


![]()
Stereopy - Spatial Transcriptomics Analysis in Python
Stereopy is a fundamental and comprehensive tool for mining and visualization based on spatial transcriptomics data, such as Stereo-seq (spatial enhanced resolution omics sequencing) data. More analysis will be added here, either from other popular tools or developed by ourselves, to meet diverse requirements. Meanwhile, we are still working on the improvement of performance and calculation efficiency.
Get quickly started by browsing Usage Principles, Tutorials or API.
Open to discuss and provide feedback on Github.
Follow changes in Release Notes.
News
The paper of Stereopy has been pre-printed on bioRxiv!
Highlights
More suitable for performing downstream analysis of Stereo-seq data.
Support efficient reading and writing (IO), pre-processing, and standardization of multiple spatial transcriptomics data formats.
Self-developed Gaussian smoothing model, tissue and cell segmentation algorithm models, and cell correction algorithm.
Integrate various functions of dimensionality reduction, spatiotemporal clustering, cell clustering, spatial expression pattern analysis, etc.
Develop interactive visualization functions based on features of Stereo-seq workflow.
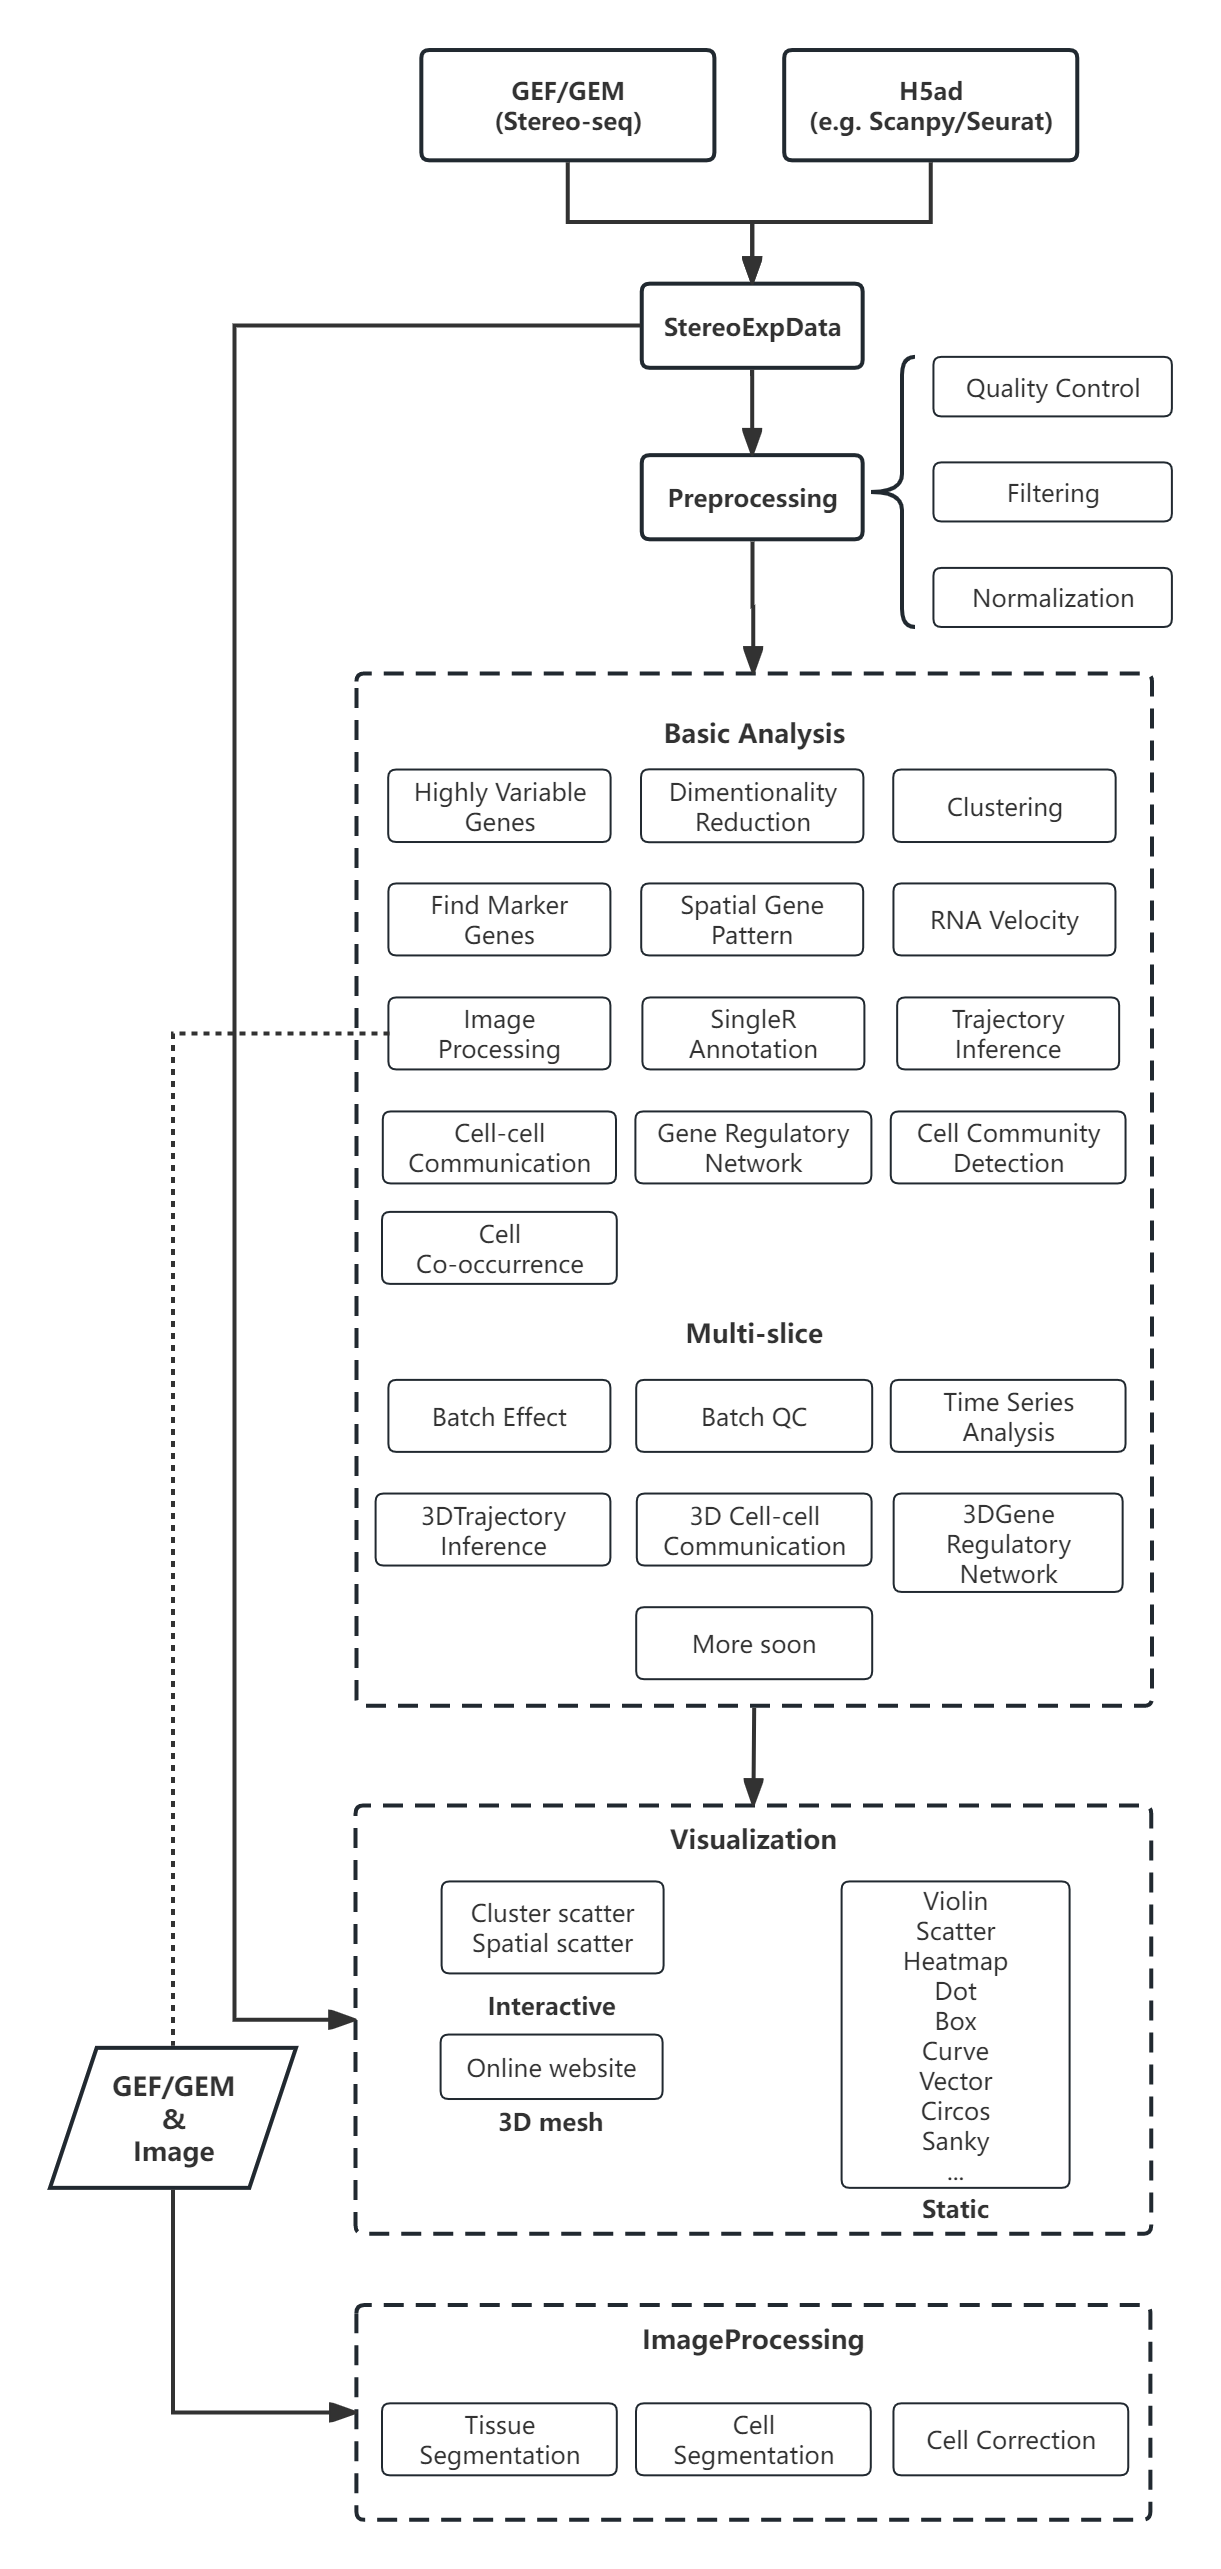
Workflow
Latest Additions
Version 1.6.2
1.6.2 : 2025-11-20
BUG Fixes:
Fixed a crash issue in
st.io.read_gefwhen reading GEF files with a gene expression level larger than 4 x 10⁹.Fixed a crash issue in
st.io.read_gefwhen reading GEF files larger than 30 GB.Fixed missing exon data when saving mid-results to a GEF file using
st.io.write_mid_gefafter analysis.Fixed inconsistent cellid in the output when generating a Loom file via
st.tools.generate_loom, ensuring they now match those in the source GEF/GEM files.Fixed an error in
st.tools.generate_loomwhen processing .tissue.gef files generated by the SAW-ST-V8 pipeline.
Version 1.6.1
1.6.1 : 2025-06-16
Features:
st.io.stereo_to_anndatasupports adding multiple images.st.plt.batches_umapsupports downloading.
BUG Fixes:
Pinned the version of fastcluster in dependencies to 1.2.6 for ensuring installation compatibility.
Fixed the problem that the width and height of the images added to AnnData by
st.io.stereo_to_anndatawere swapped.Fixed the problem that the order of bins is different in GEM and GEF under a same data.
Version 1.6.0
1.6.0 : 2025-02-21
Features:
Addition of new algorithm Spatialign for batch effect removal.
Version 1.5.1
1.5.1 : 2024-12-26
Features:
st.io.stereo_to_anndatasupports adding image information into the converted AnnData object.h5ad2rds.R supports adding image information into the converted RDS file.
Optimized the visualization of the plotting scale for spatial scatter plot when inputting small data.
BUG Fixes:
Fixed the problem that the layers was lost when converting StereoExpData to AnnData by using
st.io.stereo_to_anndata.Fixed the problem that the result of
st.tl.gen_ccc_micro_envscannot be reproduced.