RNA Velocity
As a powerful assessment of cell status, RNA velocity analyses expression dynamics based on scRNA-seq data, which generates the spliced and unspliced matrices in loom file, also called RNA abundance.
For example, we use exon information of GEM/GEF file to generate the spliced and unspliced matrices in the loom file. Therefore, it is necessary to ensure that GEM/GEF file is obtained from spatial_RNA_visualization_v5 in SAP or SAW (version >= 5.1.3).
The annotation logic in SAW is calculating overlap area with exon. If the overlap area with exon information is greater than 50%, it is considered that the transcript belongs to exon.
Loom file
Import the module to generate loom file, please download our example data previously.
If the gef file input by the user is for the SAW-ST-V8 process and an error occurs during direct execution, then add a monkey patch code first and then re-run.
[ ]:
# gef file generate by SAW-ST-V8 process
import pandas as pd
import warnings

original_read_csv=pd.read_csv

def patched_read_csv(*args,**kwargs):
    # 移除废弃的参数
    kwargs.pop('error bad lines', None)
    kwargs.pop('warn bad lines', None)

    if 'on_bad_lines' not in kwargs:
            kwargs['on_bad_lines'] = 'warn'
    return original_read_csv(*args,**kwargs)

pd.read_csv= patched_read_csv
[5]:
from stereo.tools import generate_loom

bgef_file = './SS200000135TL_D1.tissue.gef'
gtf_file = './genes.gtf'
out_dir = './SS200000135TL_D1_bgef'

# generate loom file
loom_data = generate_loom(
                gef_path=bgef_file,
                gtf_path=gtf_file,
                bin_type='bins',
                bin_size=100,
                out_dir=out_dir
                )
[2023-04-03 10:56:33][Stereo][20511][MainThread][139671934703424][rna_velocity][66][INFO]: Getting layers
[2023-04-03 10:58:22][Stereo][20511][MainThread][139671934703424][rna_velocity][77][INFO]: Getting row attrs from gtf
INFO:root:Extracted GTF attributes: ['gene_id', 'gene_version', 'gene_name', 'gene_source', 'gene_biotype', 'transcript_id', 'transcript_version', 'transcript_name', 'transcript_source', 'transcript_biotype', 'transcript_support_level', 'exon_number', 'exon_id', 'exon_version', 'tag', 'ccds_id', 'protein_id', 'protein_version']
[2023-04-03 11:09:37][Stereo][20511][MainThread][139671934703424][rna_velocity][80][INFO]: Generating loom
Note
If you want to generate loom file through GEM file, use the parameter gem_path. Pay attention to the parameter bin_type which must be set to 'cell_bins' when use files of .cellbin.gef or .cellbin.gem.
Analysis on Dynamo
We recommend Dynamo to subsequent analysis of RNA velocity. Now that Dynamo has been released to PyPI, learn about the usage on its document. Dynamo now has been released to PyPI, you can install the PyPI version via: pip install dynamo-release and pip install cdlib.
[ ]:
#pip install dynamo-release
#pip install cdlib
import dynamo as dyn

# set visualization mode
dyn.configuration.set_figure_params('dynamo', background='white')

# read data
adata = dyn.read_loom(loom_data)
dyn.pp.recipe_monocle(
            adata,
            num_dim=30,
            keep_filtered_genes = True
            )

dyn.tl.dynamics(adata, model='stochastic', cores=60)
dyn.tl.moments(adata)
dyn.tl.reduceDimension(adata)
The spatial coordinates of each cell are stored in the index of adata.obs.index which consists of coordinate x and coordiante y.
[15]:
adata.obs['x'] = list(map(lambda x: float(x.split("_")[0]) ,list(adata.obs.index)))
adata.obs['y'] = list(map(lambda x: float(x.split("_")[1]) ,list(adata.obs.index)))

adata.obsm['spatial'] = adata.obs[['x', 'y']].values.astype(float)
adata.obsm['X_spatial'] = adata.obs[['x', 'y']].values.astype(float)
Leiden clustering after RNA velovity.
[ ]:
dyn.tl.cell_velocities(
            adata,
            method='fp',
            basis='X_spatial',
            enforce=True,
            transition_genes = list(adata.var_names[adata.var.use_for_pca])
            )

dyn.tl.cell_wise_confidence(adata)
dyn.tl.leiden(adata, result_key='spatial_leiden_res')
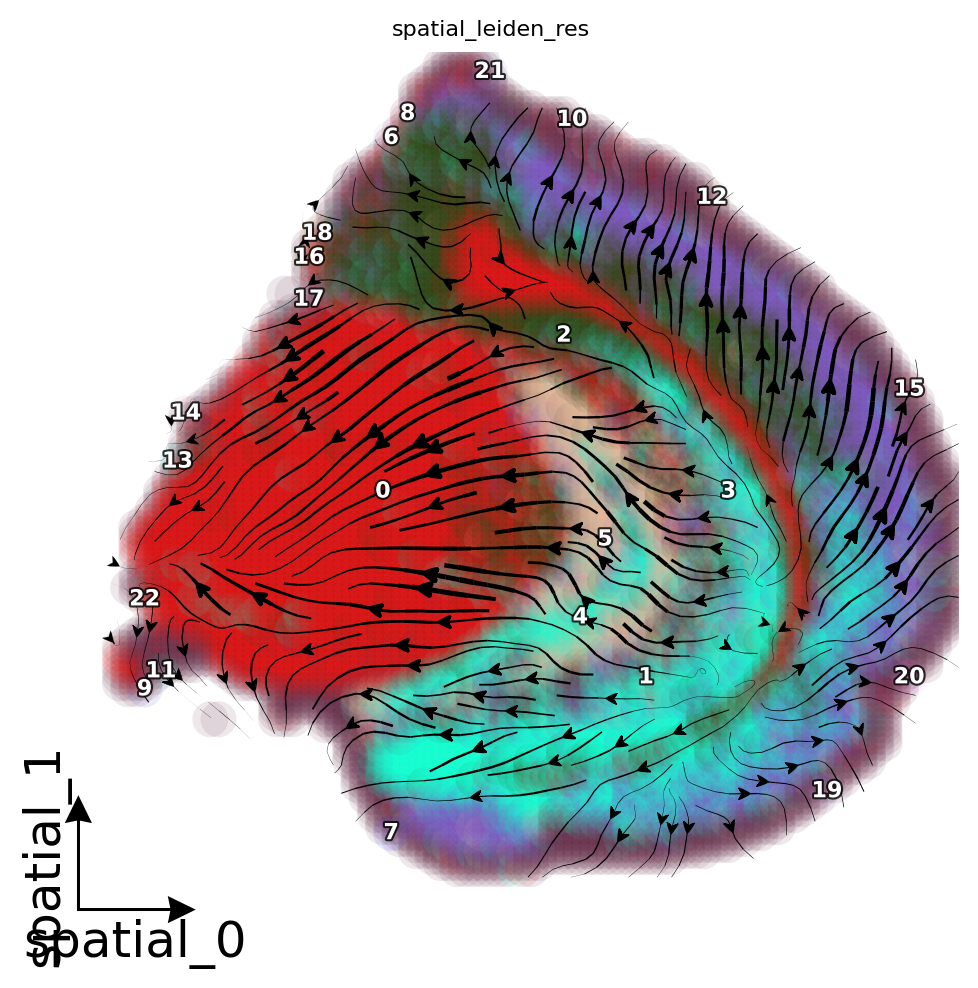
Display the streamline plot of RNA velocity.
[19]:
dyn.pl.streamline_plot(
            adata,
            color = 'spatial_leiden_res',
            basis='X_spatial',
            quiver_length=6,
            quiver_size=6,
            show_arrowed_spines=True,
            figsize=(6, 6)
            )
|-----> retrive data for non-linear dimension reduction...
|-----? adata already have basis spatial. dimension reduction spatial will be skipped!
set enforce=True to re-performing dimension reduction.
|-----> Start computing neighbor graph...
|-----------> X_data is None, fetching or recomputing...
|-----> fetching X data from layer:None, basis:pca
|-----> method arg is None, choosing methods automatically...
|-----------> method ball_tree selected
|-----> <insert> connectivities to obsp in AnnData Object.
|-----> <insert> distances to obsp in AnnData Object.
|-----> <insert> neighbors to uns in AnnData Object.
|-----> <insert> neighbors.indices to uns in AnnData Object.
|-----> <insert> neighbors.params to uns in AnnData Object.
|-----> [dimension_reduction projection] in progress: 100.0000%
|-----> [dimension_reduction projection] finished [28.5842s]
|-----? Some row sums(out degree) in adata's neighbor graph are zero.
|-----> Neighbor graph is broken, recomputing....
|-----> Start computing neighbor graph...
|-----------> X_data is None, fetching or recomputing...
|-----> fetching X data from layer:None, basis:pca
|-----> method arg is None, choosing methods automatically...
|-----------> method ball_tree selected
|-----> <insert> connectivities to obsp in AnnData Object.
|-----> <insert> distances to obsp in AnnData Object.
|-----> <insert> neighbors to uns in AnnData Object.
|-----> <insert> neighbors.indices to uns in AnnData Object.
|-----> <insert> neighbors.params to uns in AnnData Object.
|-----> 0 genes are removed because of nan velocity values.
|-----> [calculating transition matrix via pearson kernel with sqrt transform.] in progress: 100.0000%
|-----> [calculating transition matrix via pearson kernel with sqrt transform.] finished [331.9526s]
|-----> [projecting velocity vector to low dimensional embedding] in progress: 100.0000%
|-----> [projecting velocity vector to low dimensional embedding] finished [9.5046s]
|-----------> plotting with basis key=X_spatial
|-----------> skip filtering spatial_leiden_res by stack threshold when stacking color because it is not a numeric type