Time Series Analysis
This part introduces how to perform time series analysis among multi samples [Fang23].
Using
pagamethod to find out time seires samples’ developmental trajectory.Using
time_series_analysismethod to find essentail genes during development.
Download the demo data Time Series Developing Mouse Brain.
This Data is the embyro developing mouse brain from E9.5 to E16.5.
MSData construction
[5]:
import os
import stereo as st
from natsort import natsorted
from stereo.core.ms_pipeline import slice_generator
from stereo.core.ms_data import MSData

data_dir = "../data/Embyro/"

file_list = [os.path.join(data_dir, f) for f in os.listdir(data_dir)]
file_list = natsorted(file_list)

# reading all slices
ms_data = MSData()
for f in file_list:
    ms_data += st.io.read_h5ad(f)

# change slides name
slides = ['E9.5', 'E10.5', 'E11.5', 'E12.5', 'E13.5', 'E14.5', 'E15.5', 'E16.5']
ms_data.names = slides
Integrate
[6]:
ms_data.integrate()
# ms_data.merged_data.position = ms_data.merged_data.position * 100

ms_data.tl.raw_checkpoint()

# preprocessing
ms_data.tl.normalize_total()
ms_data.tl.log1p()

# embedding
ms_data.tl.pca(svd_solver='arpack', n_pcs=20)
ms_data.tl.neighbors(n_neighbors=15, n_jobs=-1, pca_res_key='pca')
[2023-11-20 17:02:54][Stereo][157054][MainThread][139923996649280][ms_pipeline][131][INFO]: data_obj(idx=0) in ms_data start to run raw_checkpoint
[2023-11-20 17:03:09][Stereo][157054][MainThread][139923996649280][ms_pipeline][131][INFO]: data_obj(idx=0) in ms_data start to run normalize_total
[2023-11-20 17:03:09][Stereo][157054][MainThread][139923996649280][st_pipeline][41][INFO]: start to run normalize_total...
[2023-11-20 17:04:32][Stereo][157054][MainThread][139923996649280][st_pipeline][44][INFO]: normalize_total end, consume time 81.4425s.
[2023-11-20 17:04:32][Stereo][157054][MainThread][139923996649280][ms_pipeline][131][INFO]: data_obj(idx=0) in ms_data start to run log1p
[2023-11-20 17:04:32][Stereo][157054][MainThread][139923996649280][st_pipeline][41][INFO]: start to run log1p...
[2023-11-20 17:04:45][Stereo][157054][MainThread][139923996649280][st_pipeline][44][INFO]: log1p end, consume time 12.7426s.
[2023-11-20 17:04:45][Stereo][157054][MainThread][139923996649280][ms_pipeline][131][INFO]: data_obj(idx=0) in ms_data start to run pca
[2023-11-20 17:04:45][Stereo][157054][MainThread][139923996649280][st_pipeline][41][INFO]: start to run pca...
[2023-11-20 17:08:32][Stereo][157054][MainThread][139923996649280][st_pipeline][44][INFO]: pca end, consume time 226.8921s.
[2023-11-20 17:08:32][Stereo][157054][MainThread][139923996649280][ms_pipeline][131][INFO]: data_obj(idx=0) in ms_data start to run neighbors
[2023-11-20 17:08:32][Stereo][157054][MainThread][139923996649280][st_pipeline][41][INFO]: start to run neighbors...
[2023-11-20 17:11:48][Stereo][157054][MainThread][139923996649280][st_pipeline][44][INFO]: neighbors end, consume time 196.2785s.
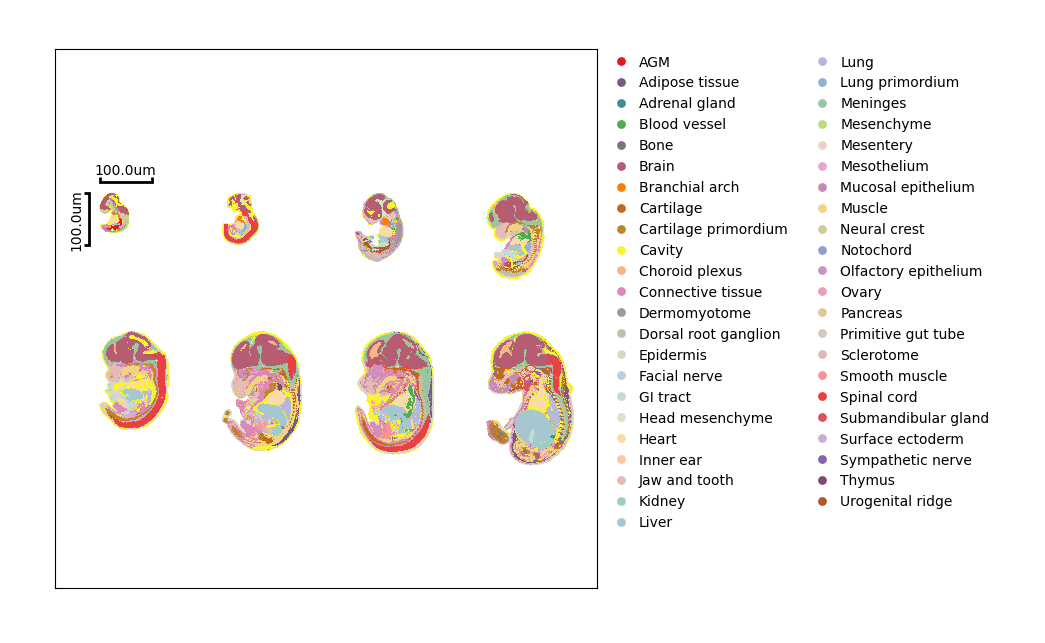
Get annotation from single slice individually.
[7]:
ms_data.to_integrate(scope=slice_generator[:],res_key='annotation',_from=slice_generator[:], type='obs',item=['annotation']*ms_data.num_slice)
[4]:
ms_data.plt.cluster_scatter(
    mode='integrate',
    scope=slice_generator[:],
    res_key='annotation',
    plotting_scale_width=200,        # the width of scale
    reorganize_coordinate=4,           # the number of plots in each row
    horizontal_offset_additional=200,  # adjustment for horizontal distance
    vertical_offset_additional=200     # adjustment for vertical distance
    )
[2023-11-14 14:15:38][Stereo][3568][MainThread][140375084926784][ms_pipeline][131][INFO]: data_obj(idx=0) in ms_data start to run cluster_scatter
[4]:
PAGA to infer trajectory
[5]:
ms_data.tl.paga(groups='annotation')
ms_data
[2023-11-14 14:15:44][Stereo][3568][MainThread][140375084926784][ms_pipeline][121][INFO]: register algorithm paga to <class 'stereo.core.stereo_exp_data.StereoExpData'>-140373552494528
[5]:
ms_data: {'E9.5': (5913, 23761), 'E10.5': (18408, 23761), 'E11.5': (30124, 23761), 'E12.5': (51365, 23761), 'E13.5': (77369, 23761), 'E14.5': (102519, 23761), 'E15.5': (113350, 23761), 'E16.5': (121767, 23761)}
num_slice: 8
names: ['E9.5', 'E10.5', 'E11.5', 'E12.5', 'E13.5', 'E14.5', 'E15.5', 'E16.5']
obs: ['batch', 'annotation']
var: []
relationship: other
var_type: intersect to 23761
mss: ["scope_[0,1,2,3,4,5,6,7]:['pca', 'pca_variance_ratio', 'neighbors', 'annotation', 'paga']"]
Optional dpt to decide trajectory direction
[6]:
import numpy as np
ms_data.merged_data.tl.result['iroot'] = np.flatnonzero((ms_data.merged_data.cells['batch'] == '0') & (ms_data.merged_data.cells['annotation'] == 'Brain'))[2]
ms_data.tl.dpt(n_branchings=0)
[2023-11-14 14:16:28][Stereo][3568][MainThread][140375084926784][ms_pipeline][121][INFO]: register algorithm dpt to <class 'stereo.core.stereo_exp_data.StereoExpData'>-140373552494528
[2023-11-14 14:16:28][Stereo][3568][MainThread][140375084926784][main][989][WARNING]: Trying to run `tl.dpt` without prior call of `tl.diffmap`. Falling back to `tl.diffmap` with default parameters.
[2023-11-14 14:16:28][Stereo][3568][MainThread][140375084926784][main][21][INFO]: computing Diffusion Maps using n_comps=15(=n_dcs)
[2023-11-14 14:16:30][Stereo][3568][MainThread][140375084926784][struct][732][INFO]: finished
[2023-11-14 14:18:30][Stereo][3568][MainThread][140375084926784][struct][793][INFO]:     eigenvalues of transition matrix
    [1.         0.9999596  0.999865   0.99983835 0.9994691  0.999355
     0.9992294  0.9990097  0.99876636 0.9986292  0.9984732  0.998372
     0.99824995 0.9982127  0.998051  ]
[2023-11-14 14:18:30][Stereo][3568][MainThread][140375084926784][main][27][INFO]:     finished
added
    'X_diffmap', diffmap coordinates (stereo_exp_data.cellsm)
    'diffmap_evals', eigenvalues of transition matrix (stereo_exp_data.tl.result)
[2023-11-14 14:18:30][Stereo][3568][MainThread][140375084926784][main][1003][INFO]: computing Diffusion Pseudotime using n_dcs=10
[2023-11-14 14:18:30][Stereo][3568][MainThread][140375084926784][main][1028][INFO]:     finished
added
    'dpt_pseudotime', the pseudotime (stereo_exp_data.cells)
[7]:
ms_data
[7]:
ms_data: {'E9.5': (5913, 23761), 'E10.5': (18408, 23761), 'E11.5': (30124, 23761), 'E12.5': (51365, 23761), 'E13.5': (77369, 23761), 'E14.5': (102519, 23761), 'E15.5': (113350, 23761), 'E16.5': (121767, 23761)}
num_slice: 8
names: ['E9.5', 'E10.5', 'E11.5', 'E12.5', 'E13.5', 'E14.5', 'E15.5', 'E16.5']
obs: ['batch', 'annotation']
var: []
relationship: other
var_type: intersect to 23761
mss: ["scope_[0,1,2,3,4,5,6,7]:['pca', 'pca_variance_ratio', 'neighbors', 'annotation', 'paga', 'iroot', 'X_diffmap', 'diffmap_evals', 'dpt_pseudotime']"]
[8]:
ms_data.plt.paga_time_series_plot(
        use_col='annotation',
        batch_col='batch',
        dpt_col='diffmap_evals', # this is optional
        height=10
        )
[2023-11-14 14:18:31][Stereo][3568][MainThread][140375084926784][ms_pipeline][128][INFO]: register plot_func paga_time_series_plot to <class 'stereo.core.stereo_exp_data.StereoExpData'>-140373552494528
[8]:

[9]:
ms_data.plt.time_series_tree_plot(use_result='annotation', edges='paga', height=15)
[9]:

Temporal gene pattern for Serially up & down regulated genes
Stereopy also provide a method to explore the genes that highly correlated to the time point. The expression of gene exhibit a certain pattern along the time point. For example, you can use time_series_analysis to find up or down-regulated genes.
[8]:
ms_data.tl.time_series_analysis(
                run_method='tvg_marker',
                use_col='batch',
                branch=['0', '1', '2', '3', '4', '5', '6', '7'],
                p_val_combination='FDR'
                )
[2023-11-20 17:21:36][Stereo][157054][MainThread][139923996649280][ms_pipeline][121][INFO]: register algorithm time_series_analysis to <class 'stereo.core.stereo_exp_data.StereoExpData'>-139923659530352
INFO:numba.core.transforms:finding looplift candidates
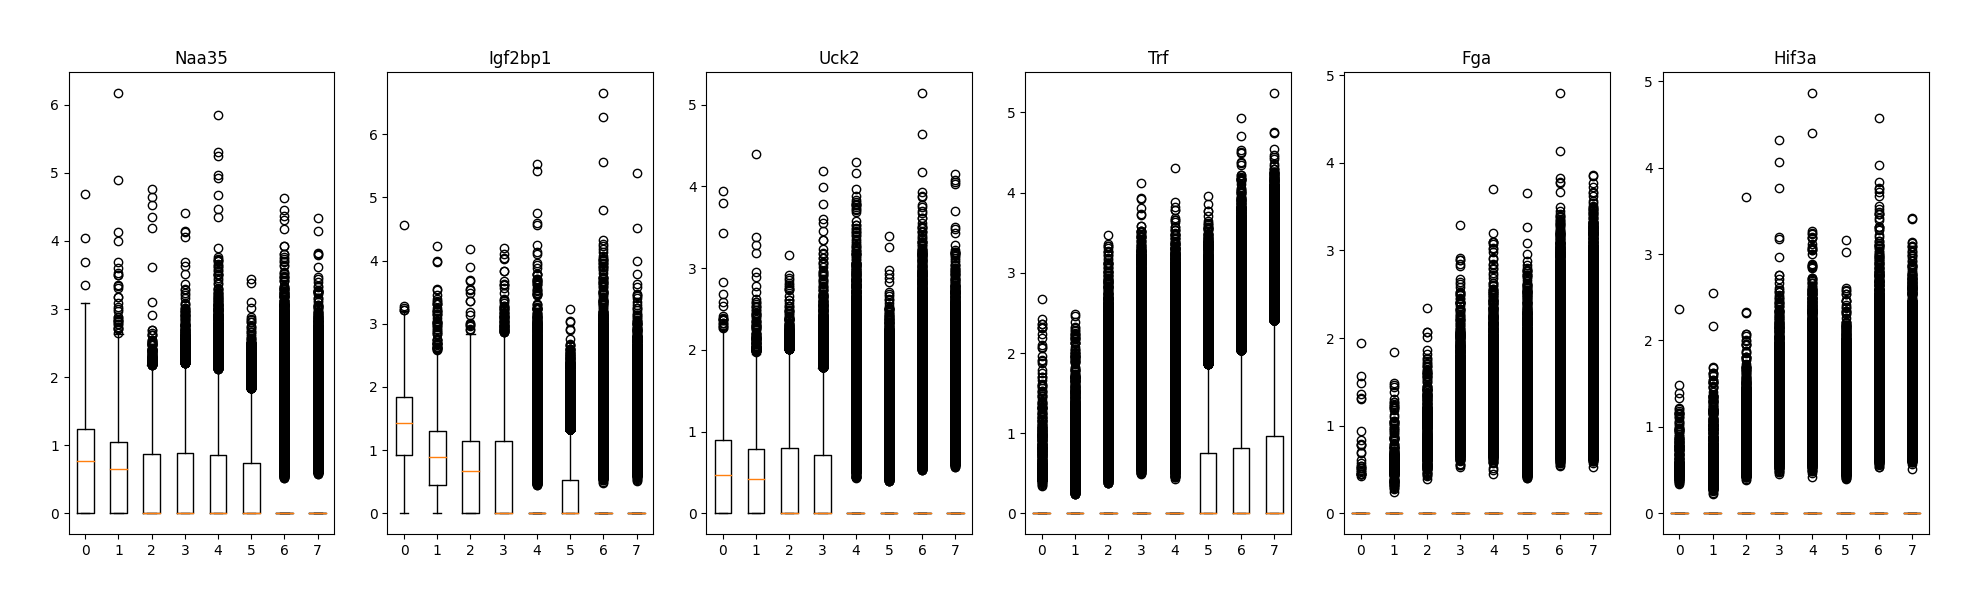
Top 3 serially down-regulated genes with lowest less_pvalue
[9]:
ms_data.var.sort_values('less_pvalue').iloc[:3]
[9]:
| less_pvalue | greater_pvalue | logFC | |
|---|---|---|---|
| Naa35 | 0.000000e+00 | 1.0 | -0.239634 |
| Igf2bp1 | 1.110223e-16 | 1.0 | -0.411088 |
| Uck2 | 2.990941e-13 | 1.0 | -0.223973 |
Top 3 serially up-regulated genes with lowest greater_pvalue
[12]:
ms_data.var.sort_values('greater_pvalue').iloc[:3]
[12]:
| less_pvalue | greater_pvalue | logFC | |
|---|---|---|---|
| Trf | 1.0 | 1.315614e-13 | 0.470321 |
| Fga | 1.0 | 5.891545e-06 | 0.756051 |
| Hif3a | 1.0 | 1.324109e-01 | 0.331680 |
[10]:
ms_data.plt.boxplot_transit_gene(
    use_col='batch',
    branch=['0', '1', '2', '3', '4', '5', '6', '7'],
    genes=['Naa35', 'Igf2bp1', 'Uck2', 'Trf', 'Fga', 'Hif3a']
    )
[2023-11-20 18:09:42][Stereo][157054][MainThread][139923996649280][ms_pipeline][128][INFO]: register plot_func boxplot_transit_gene to <class 'stereo.core.stereo_exp_data.StereoExpData'>-139923659530352
[10]:
Fuzzy’C means to cluster genes on spatial & temporal pattern
Except for up or down regulated genes, there is other expression pattern also important. Stereopy use consider both temporal and spatial information and based on which cluster genes into serveral groups.
[15]:
ms_data.tl.time_series_analysis(
    run_method='other',
    cluster_number=6,
    spatial_weight=1,
    n_spatial_feature=2,
    temporal_mean_threshold=0.85,
    temporal_top_threshold=1,
    Epsilon=1e-15,
    )
[2023-11-21 08:37:24][Stereo][157054][MainThread][139923996649280][ms_pipeline][121][INFO]: register algorithm time_series_analysis to <class 'stereo.core.stereo_exp_data.StereoExpData'>-139923659530352
epoch 100 : time cosumed1.9185s, loss:1.537990590438909e-08
epoch 200 : time cosumed1.9003s, loss:4.801714581503802e-13
[17]:
ms_data.plt.fuzz_cluster_plot(
        use_col='batch',
        branch=['0', '1', '2', '3', '4', '5', '6', '7'],
        threshold = 'p99.95',
        n_col = 3,
        summary_trend=True,
        width = None,
        height = None
        )
[2023-11-21 09:21:59][Stereo][157054][MainThread][139923996649280][ms_pipeline][128][INFO]: register plot_func fuzz_cluster_plot to <class 'stereo.core.stereo_exp_data.StereoExpData'>-139923659530352
[17]:

A volcano plot to visualize all genes expression on timepoints
The scatter size indicates the expression level of each gene on each time point.
[16]:
ms_data.plt.TVG_volcano_plot(use_col='batch', branch=['0', '1', '2', '3', '4', '5', '6', '7'])
[2023-11-14 16:11:07][Stereo][3568][MainThread][140375084926784][ms_pipeline][128][INFO]: register plot_func TVG_volcano_plot to <class 'stereo.core.stereo_exp_data.StereoExpData'>-140373552494528
INFO:numba.core.transforms:finding looplift candidates
[16]:

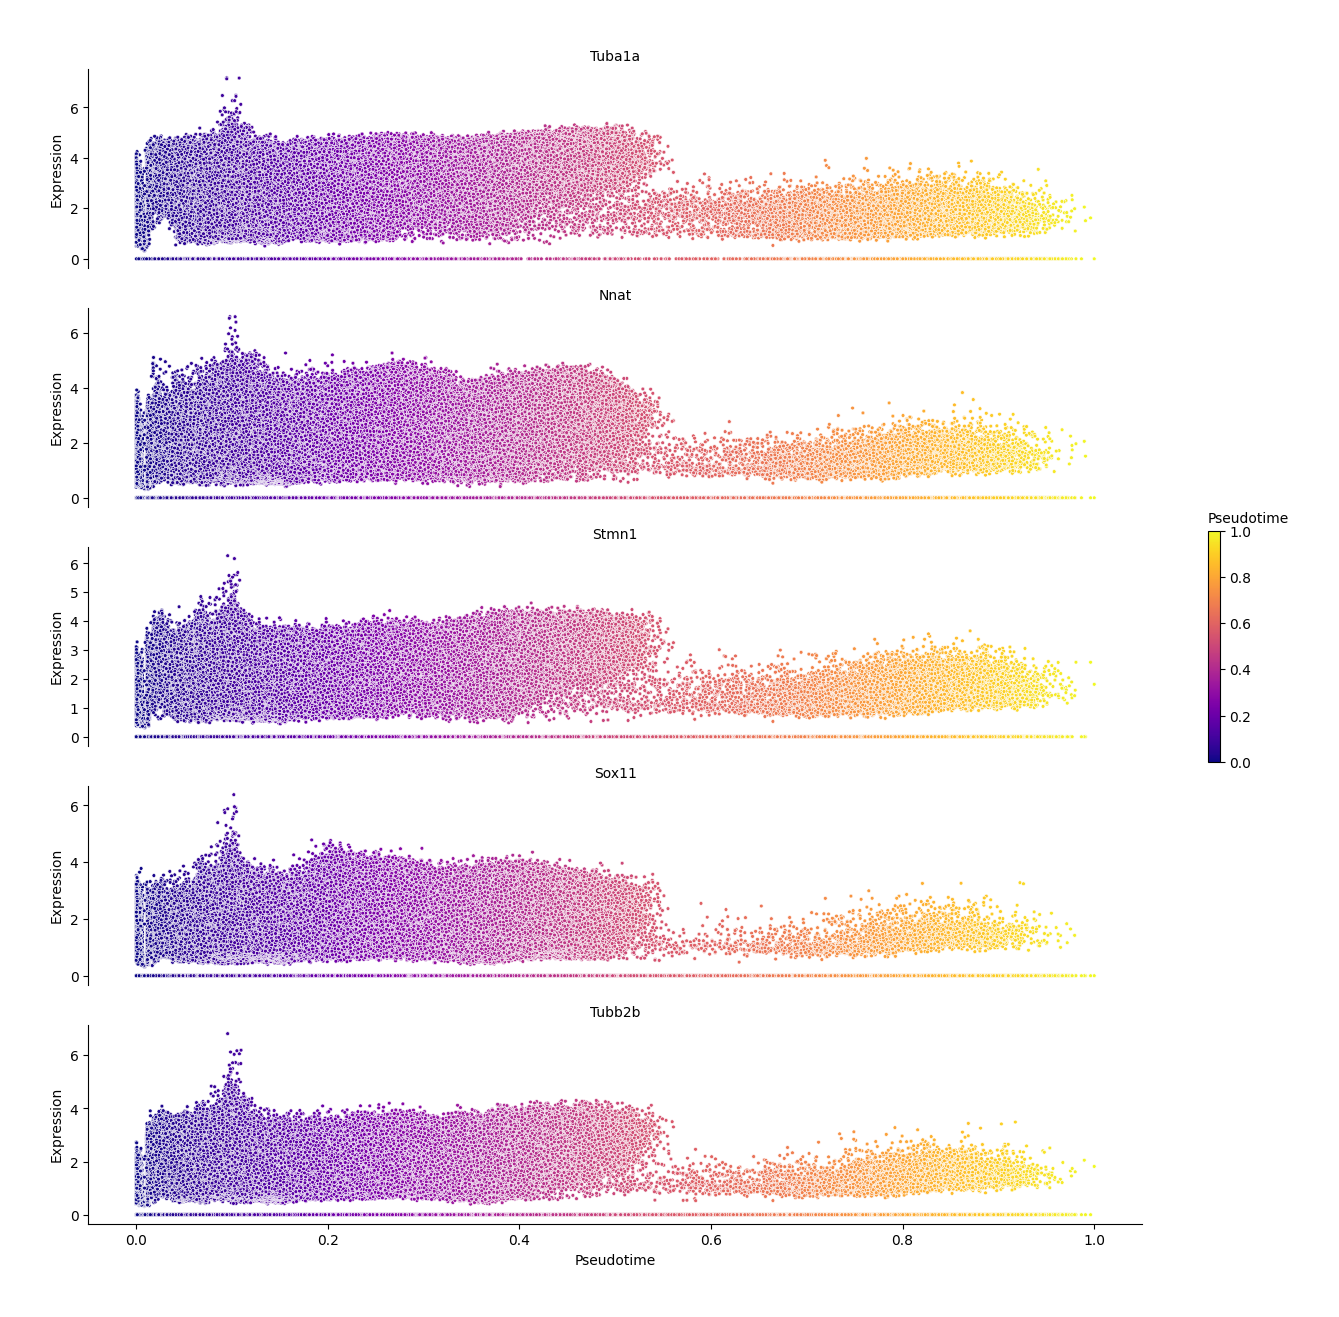
Distribution of marker genes over pseudotime
[17]:
ms_data.tl.find_marker_genes(cluster_res_key='annotation', method='t_test', use_highly_genes=False, use_raw=True, res_key='marker_genes')
[2023-11-14 16:56:43][Stereo][3568][MainThread][140375084926784][ms_pipeline][131][INFO]: data_obj(idx=0) in ms_data start to run find_marker_genes
[2023-11-14 16:56:43][Stereo][3568][MainThread][140375084926784][st_pipeline][41][INFO]: start to run find_marker_genes...
[2023-11-14 16:56:44][Stereo][3568][MainThread][140375084926784][tool_base][122][INFO]: read group information, grouping by group column.
[2023-11-14 16:56:44][Stereo][3568][MainThread][140375084926784][tool_base][151][INFO]: start to run...
[2023-11-14 16:56:44][Stereo][3568][MainThread][140375084926784][time_consume][57][INFO]: start to run calc_pct_and_pct_rest...
[2023-11-14 16:59:24][Stereo][3568][MainThread][140375084926784][time_consume][60][INFO]: calc_pct_and_pct_rest end, consume time 159.6446s.
[2023-11-14 17:16:58][Stereo][3568][MainThread][140375084926784][tool_base][153][INFO]: end to run.
[2023-11-14 17:16:58][Stereo][3568][MainThread][140375084926784][st_pipeline][44][INFO]: find_marker_genes end, consume time 1214.9132s.
[18]:
ms_data.plt.plot_genes_in_pseudotime(
    marker_genes_res_key='marker_genes',
    group='Brain',
    topn=5
    )
[2023-11-14 17:16:58][Stereo][3568][MainThread][140375084926784][ms_pipeline][128][INFO]: register plot_func plot_genes_in_pseudotime to <class 'stereo.core.stereo_exp_data.StereoExpData'>-140373552494528
[18]: