Cell Co-occurrence
Cell co-occurrence refers to the occurrence, spatial relationship, of two or more cell types in close proximity in the same tissue region. The algorithm aims to identify and quantify the interactions or associations between different cell types in order to understand their spatial organization and potential functional relationships [Fang23].
Clustering on cells
Download example data, and complete basic analysis processing.
[1]:
import stereo as st
from stereo.core.ms_data import MSData
from stereo.core.ms_pipeline import slice_generator


[2]:
data = st.io.read_h5ad('../data/Puck_191204_22.h5ad')
data.position = data._ann_data.obsm['X_spatial']
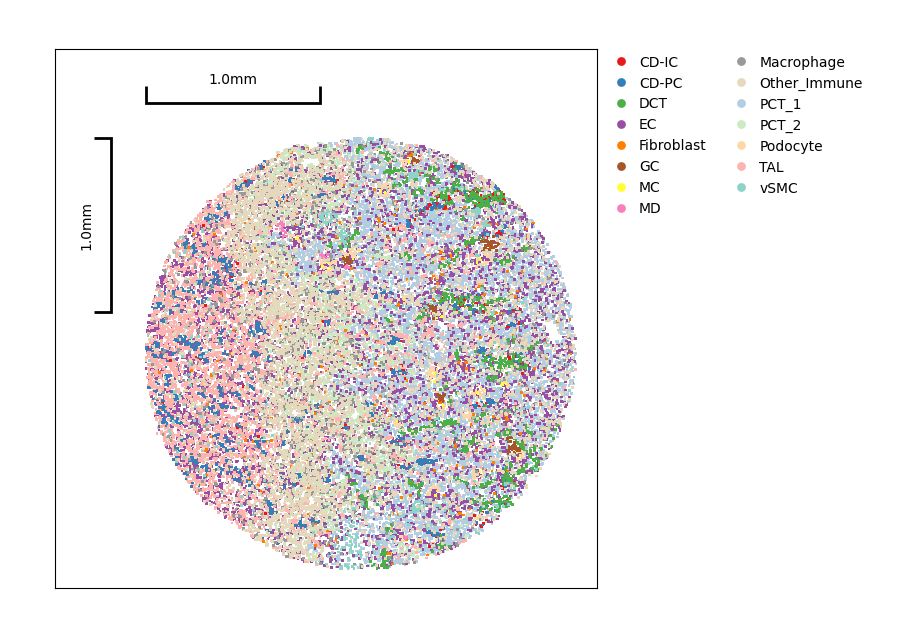
Show the distribution of clusters.
[3]:
data.plt.cluster_scatter(res_key='author_cell_type')
[3]:
Co-occurrence analysis
Here provides two method for calculate co-occurence, 'squidpy' for method in Squidpy, 'stereopy' for method in Stereopy by default.
[4]:
data.tl.co_occurrence(
method='stereopy',
cluster_res_key='author_cell_type',
res_key='co-occurrence',
dist_thres=180, # max threshold to measure co-occurence
steps=6, # step numbers to divide threshold interval evenly
genelist=None,
gene_thresh=0, # min threshold for gene expression in a cell
n_jobs=-1
)
[2023-11-13 16:33:59][Stereo][177753][MainThread][139984851941184][st_pipeline][77][INFO]: register algorithm co_occurrence to <stereo.core.st_pipeline.AnnBasedStPipeline object at 0x7f507957bdc0>
[4]:
AnnData object with n_obs × n_vars = 31600 × 21319
obs: 'assay_ontology_term_id', 'self_reported_ethnicity_ontology_term_id', 'is_primary_data', 'organism_ontology_term_id', 'sample', 'tissue_ontology_term_id', 'disease_state', 'sex_ontology_term_id', 'genotype', 'development_stage_ontology_term_id', 'author_cell_type', 'cell_type_ontology_term_id', 'disease_ontology_term_id', 'donor_id', 'suspension_type', 'cell_type', 'assay', 'disease', 'organism', 'sex', 'tissue', 'self_reported_ethnicity', 'development_stage'
var: 'feature_is_filtered', 'feature_name', 'feature_reference', 'feature_biotype'
uns: 'schema_version', 'title', 'sn', 'co-occurrence'
obsm: 'X_spatial', 'spatial'
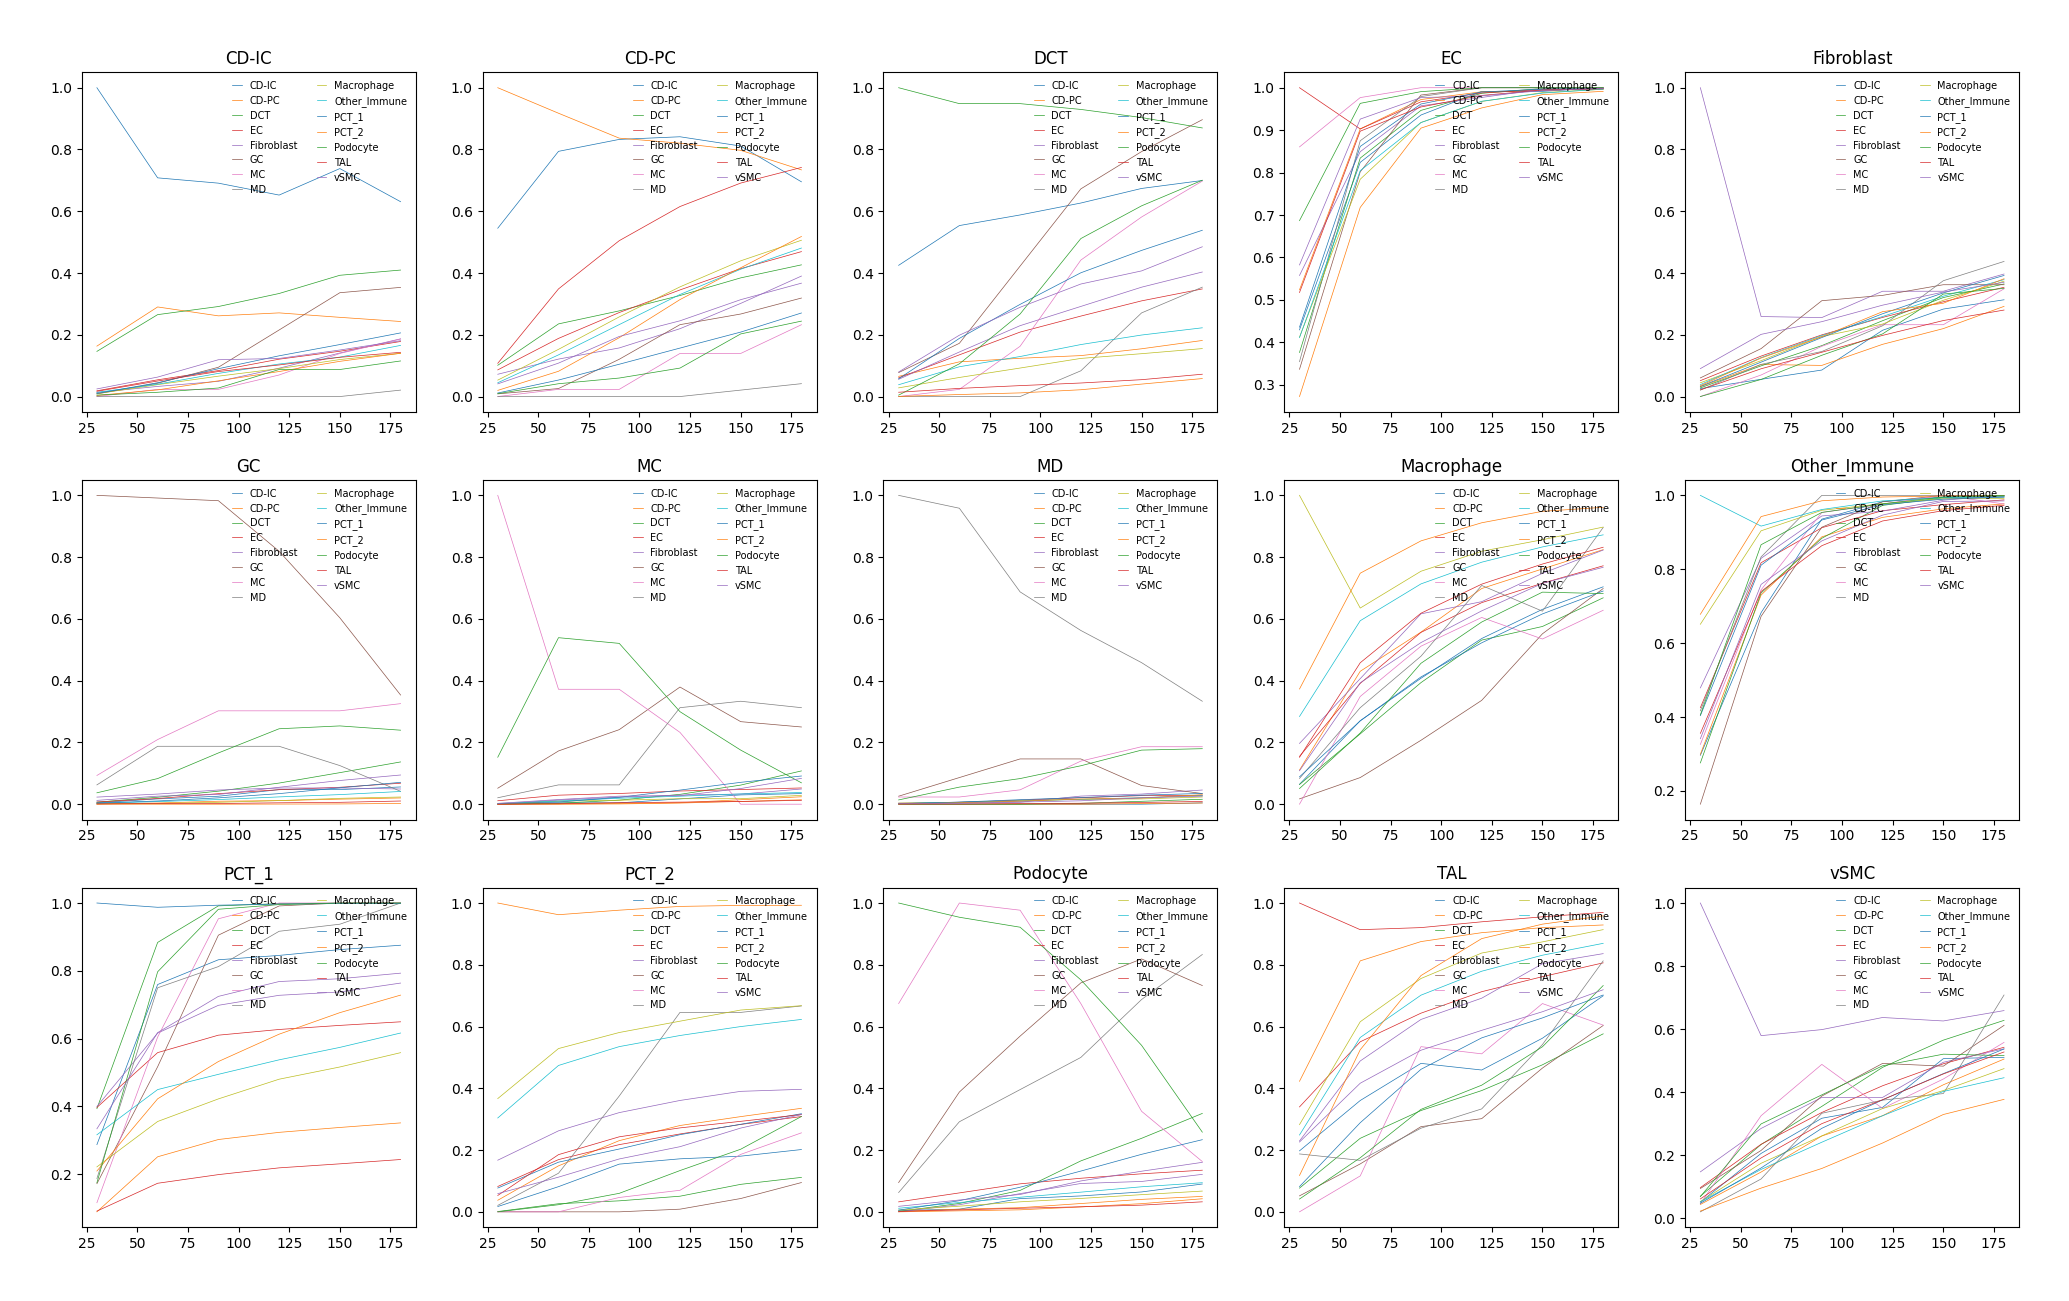
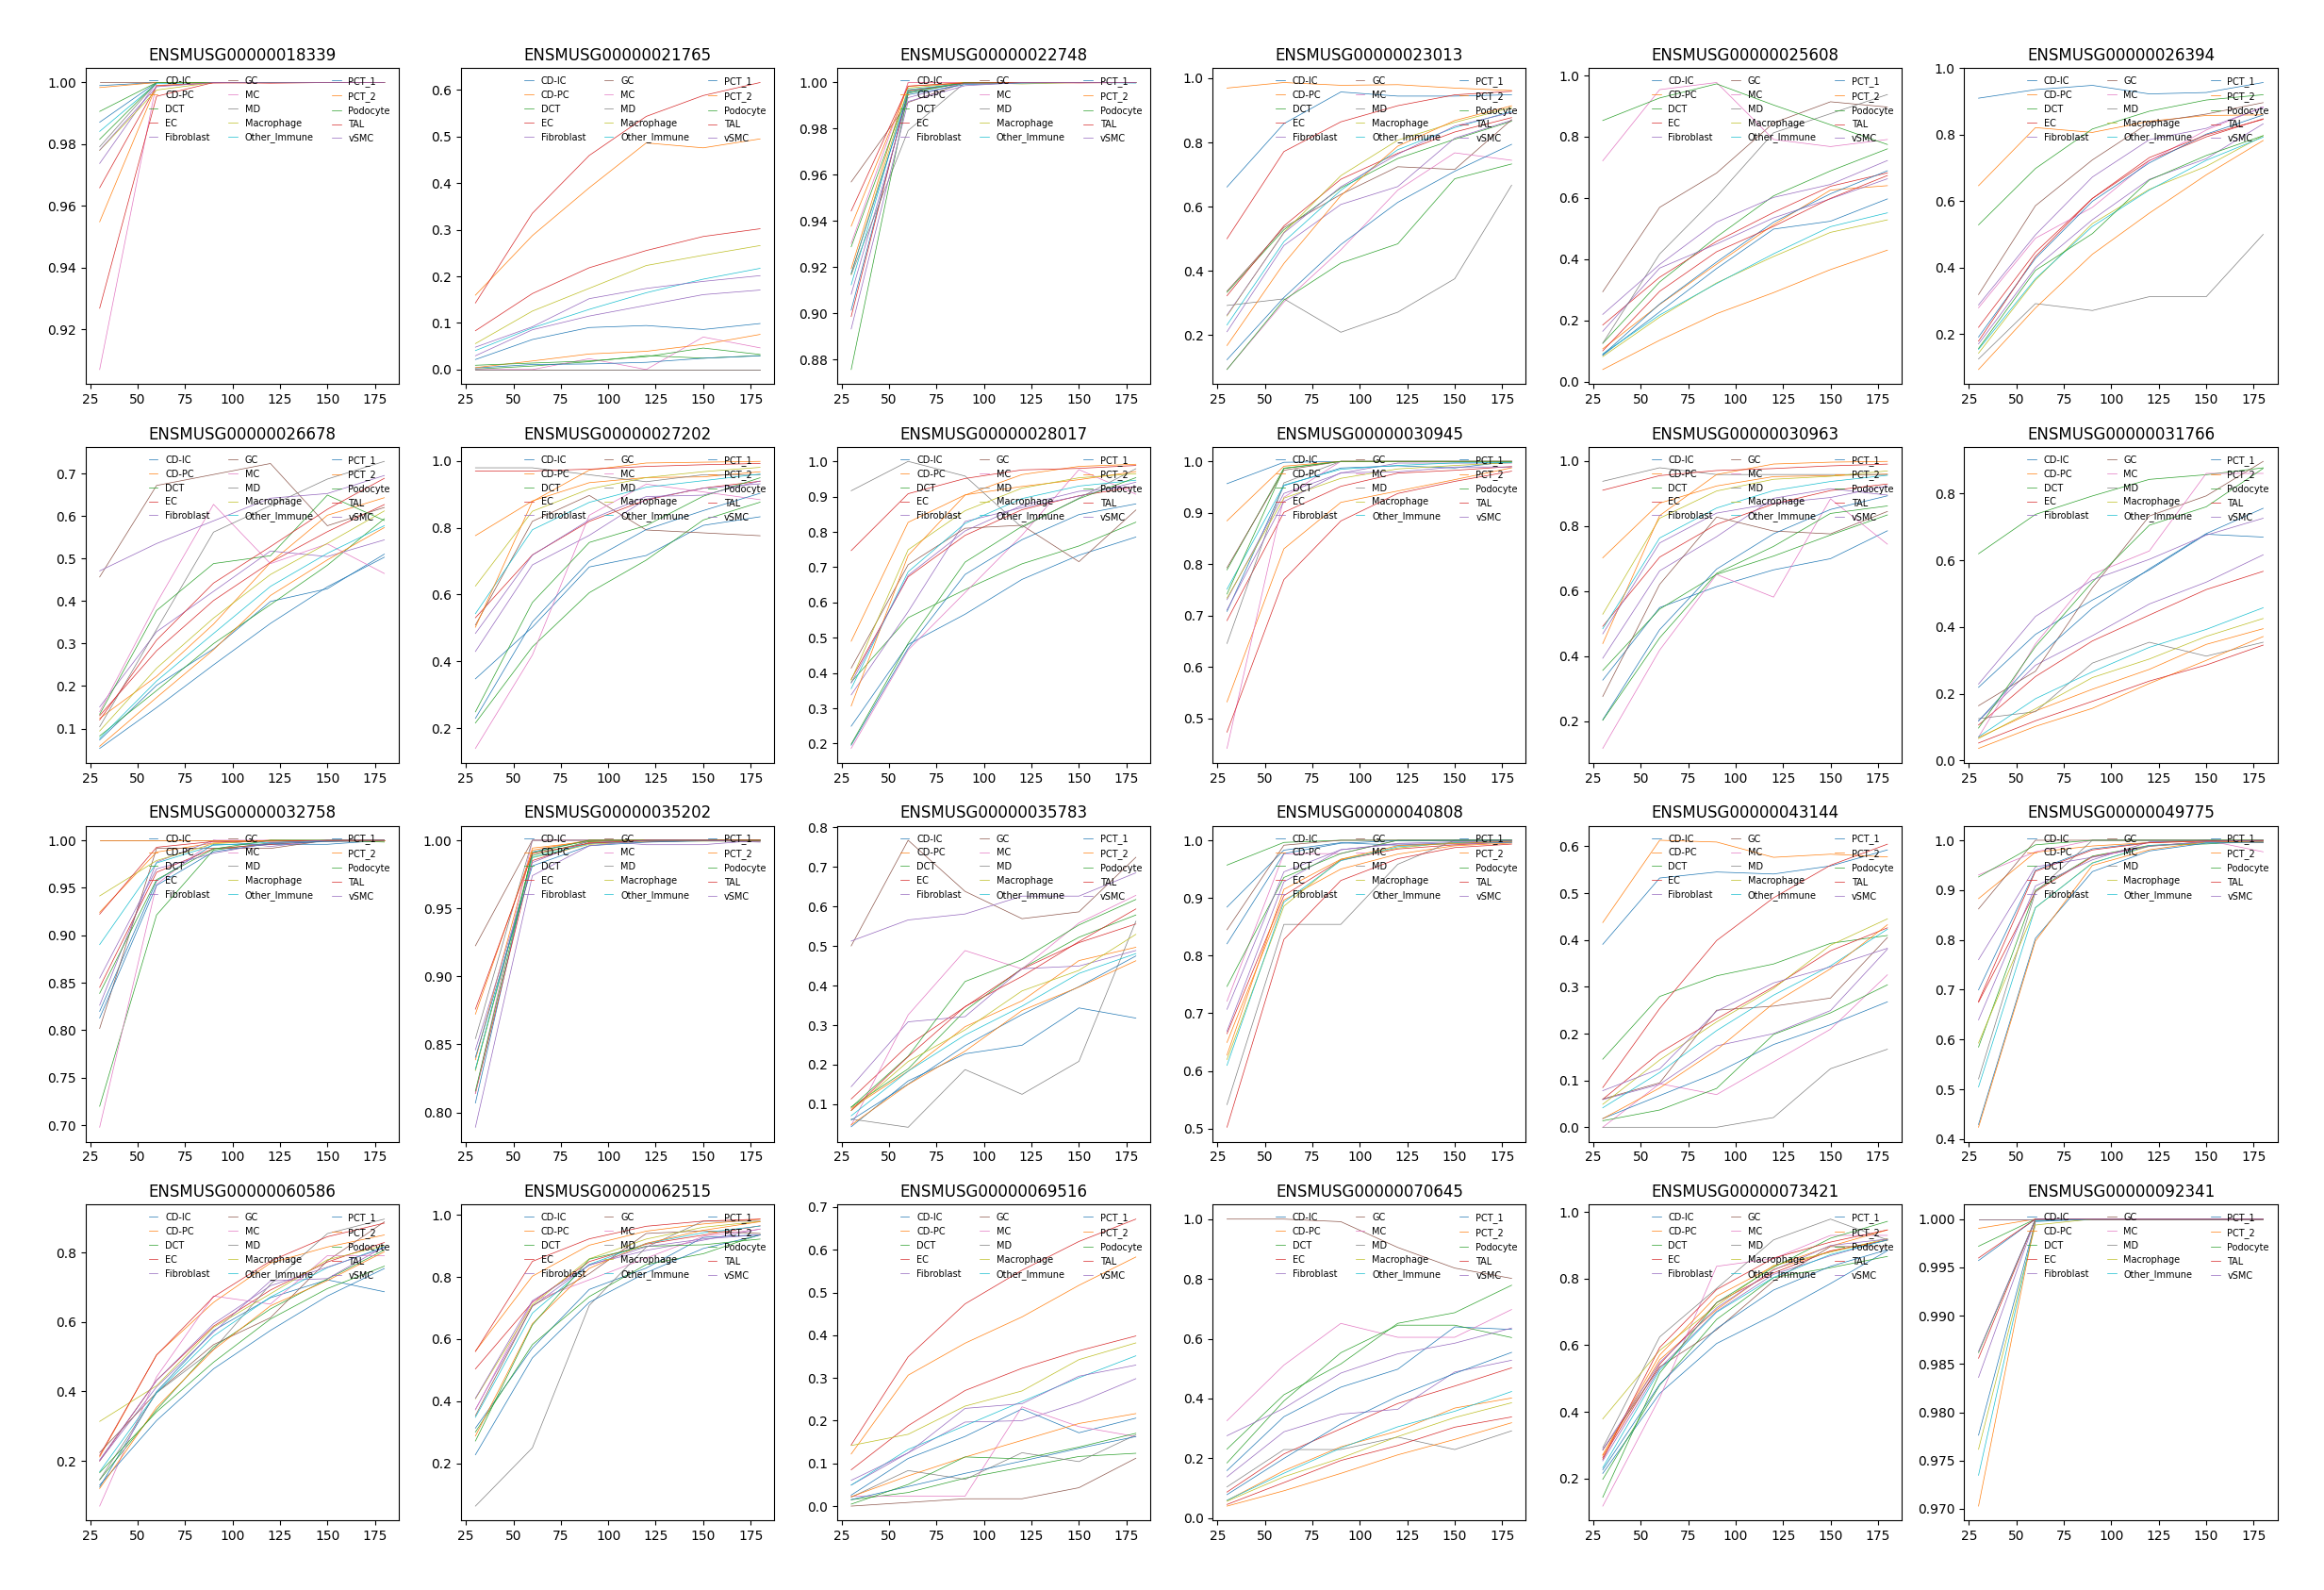
Each plot represents, along with the increase of distance, the probability of co-occurrence between the cluster in title and other clusters.
Note
Each mark on x-axis represents a distance interval but not a single value. For example, 50 means the interval from 0 to 50 while 100 is from 50 to 100 and so on.
[5]:
data.plt.co_occurrence_plot(res_key='co-occurrence')
[2023-11-13 16:34:38][Stereo][177753][MainThread][139984851941184][plot_collection][82][INFO]: register plot_func co_occurrence_plot to <stereo.plots.plot_collection.PlotCollection object at 0x7f507a578cd0>
[5]:
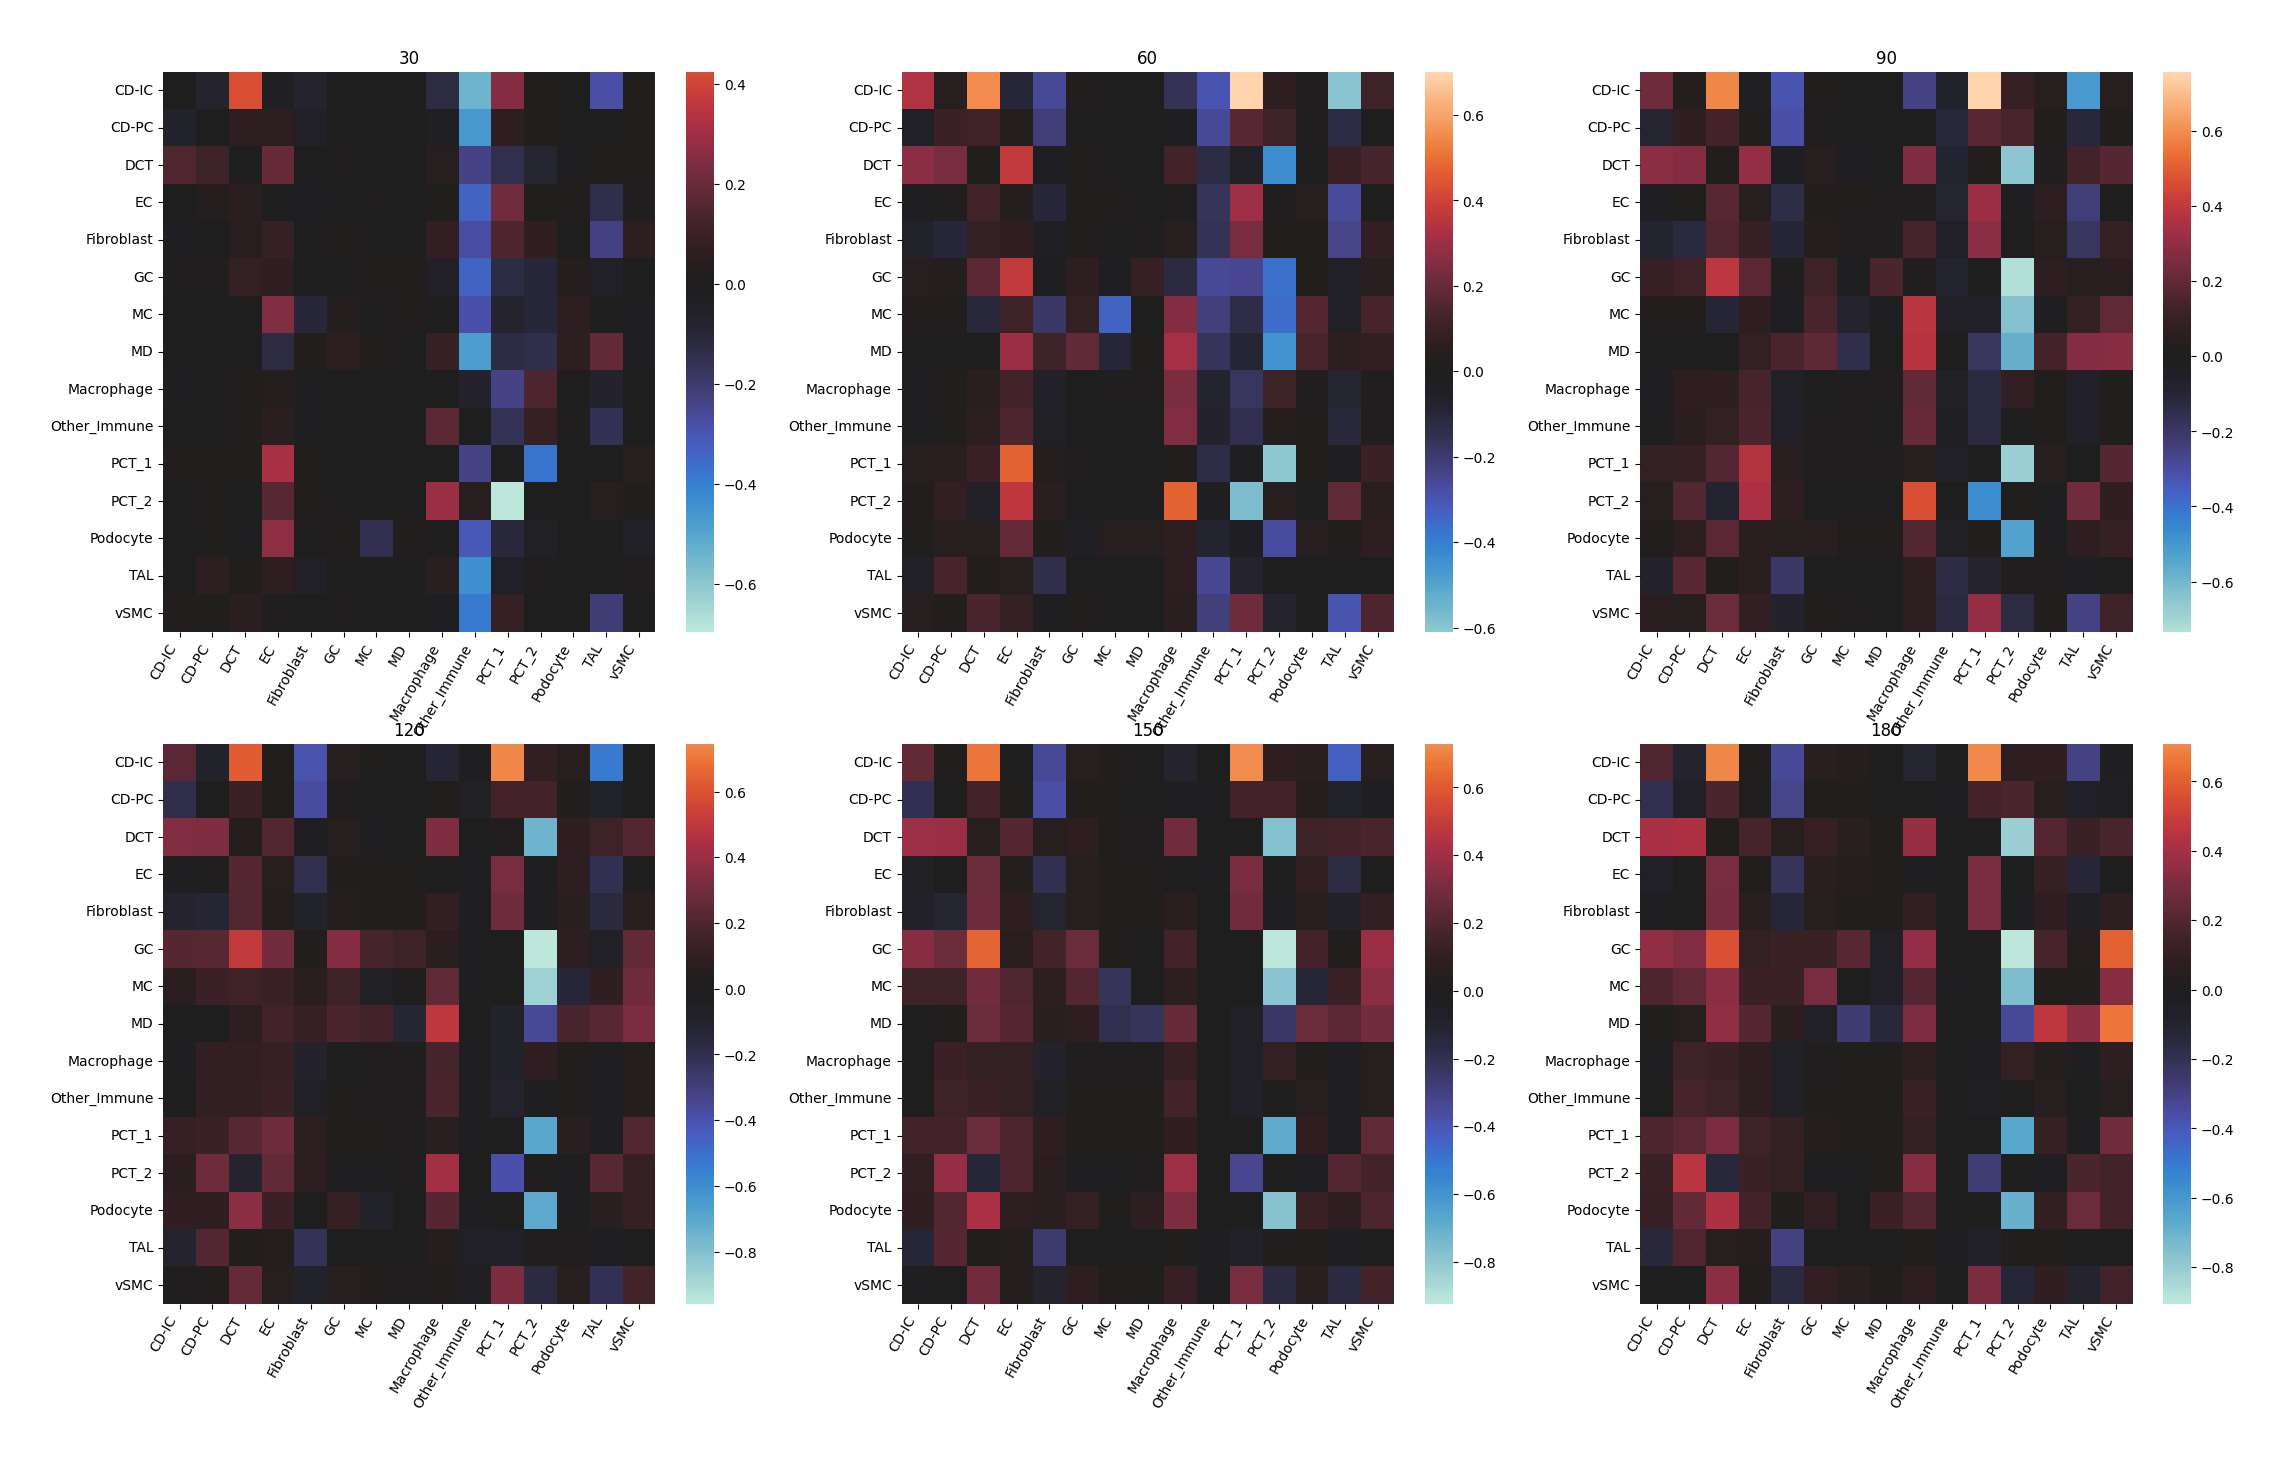
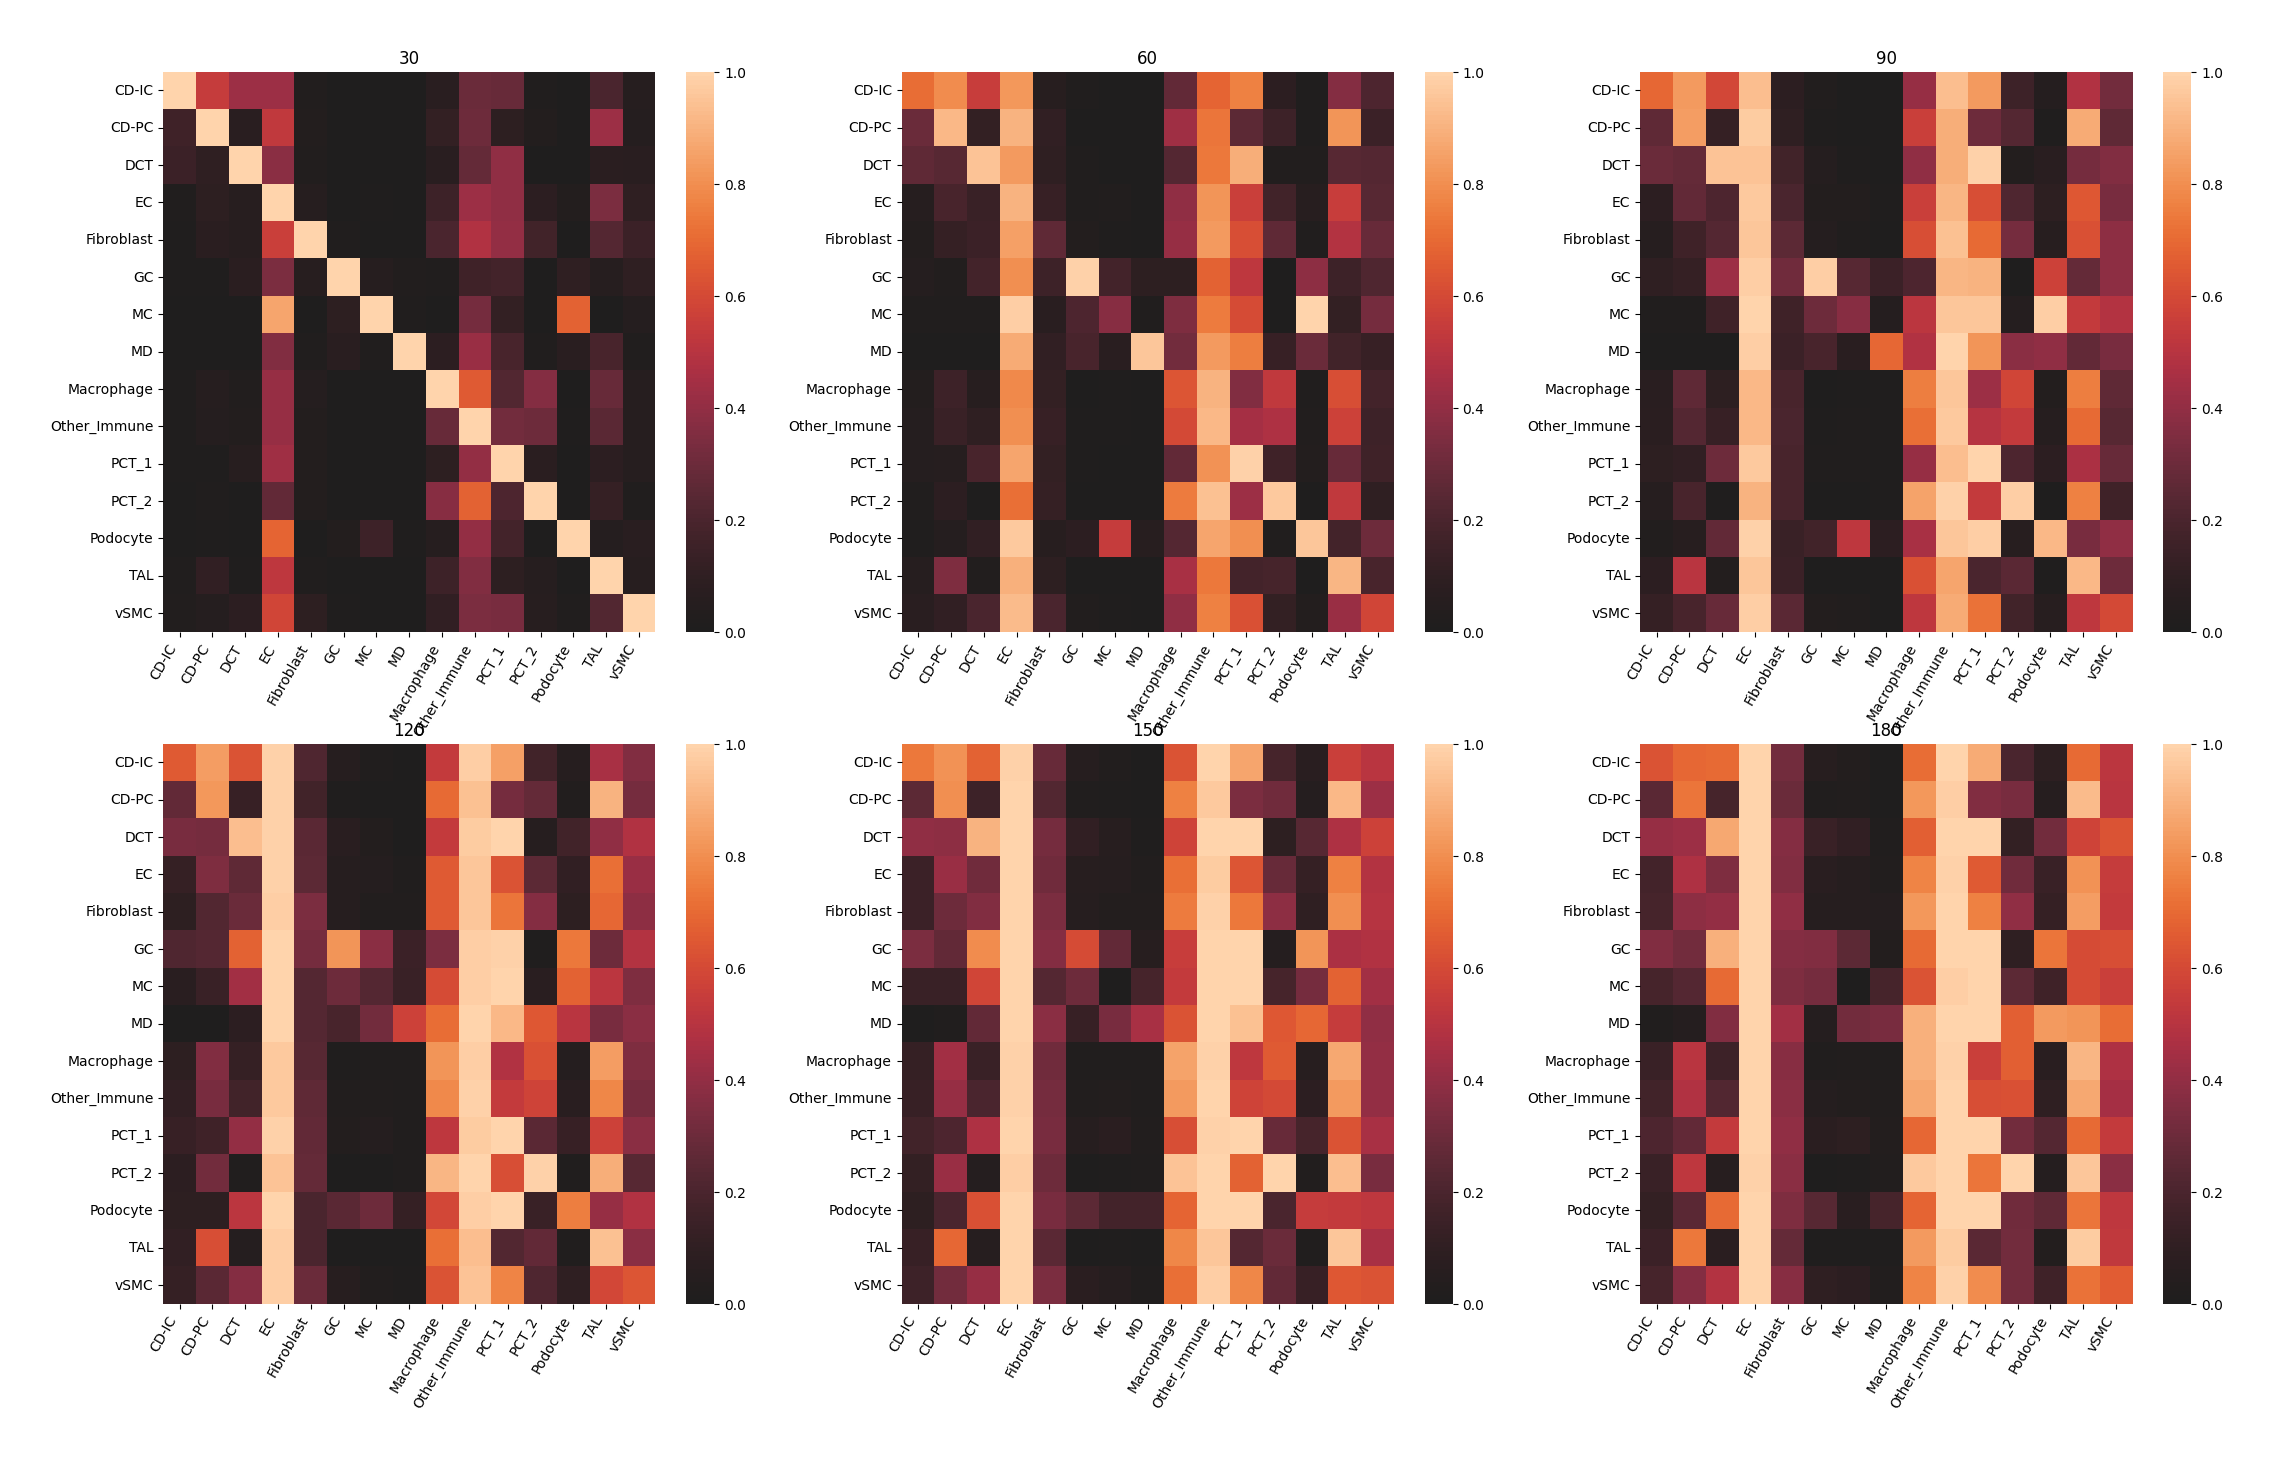
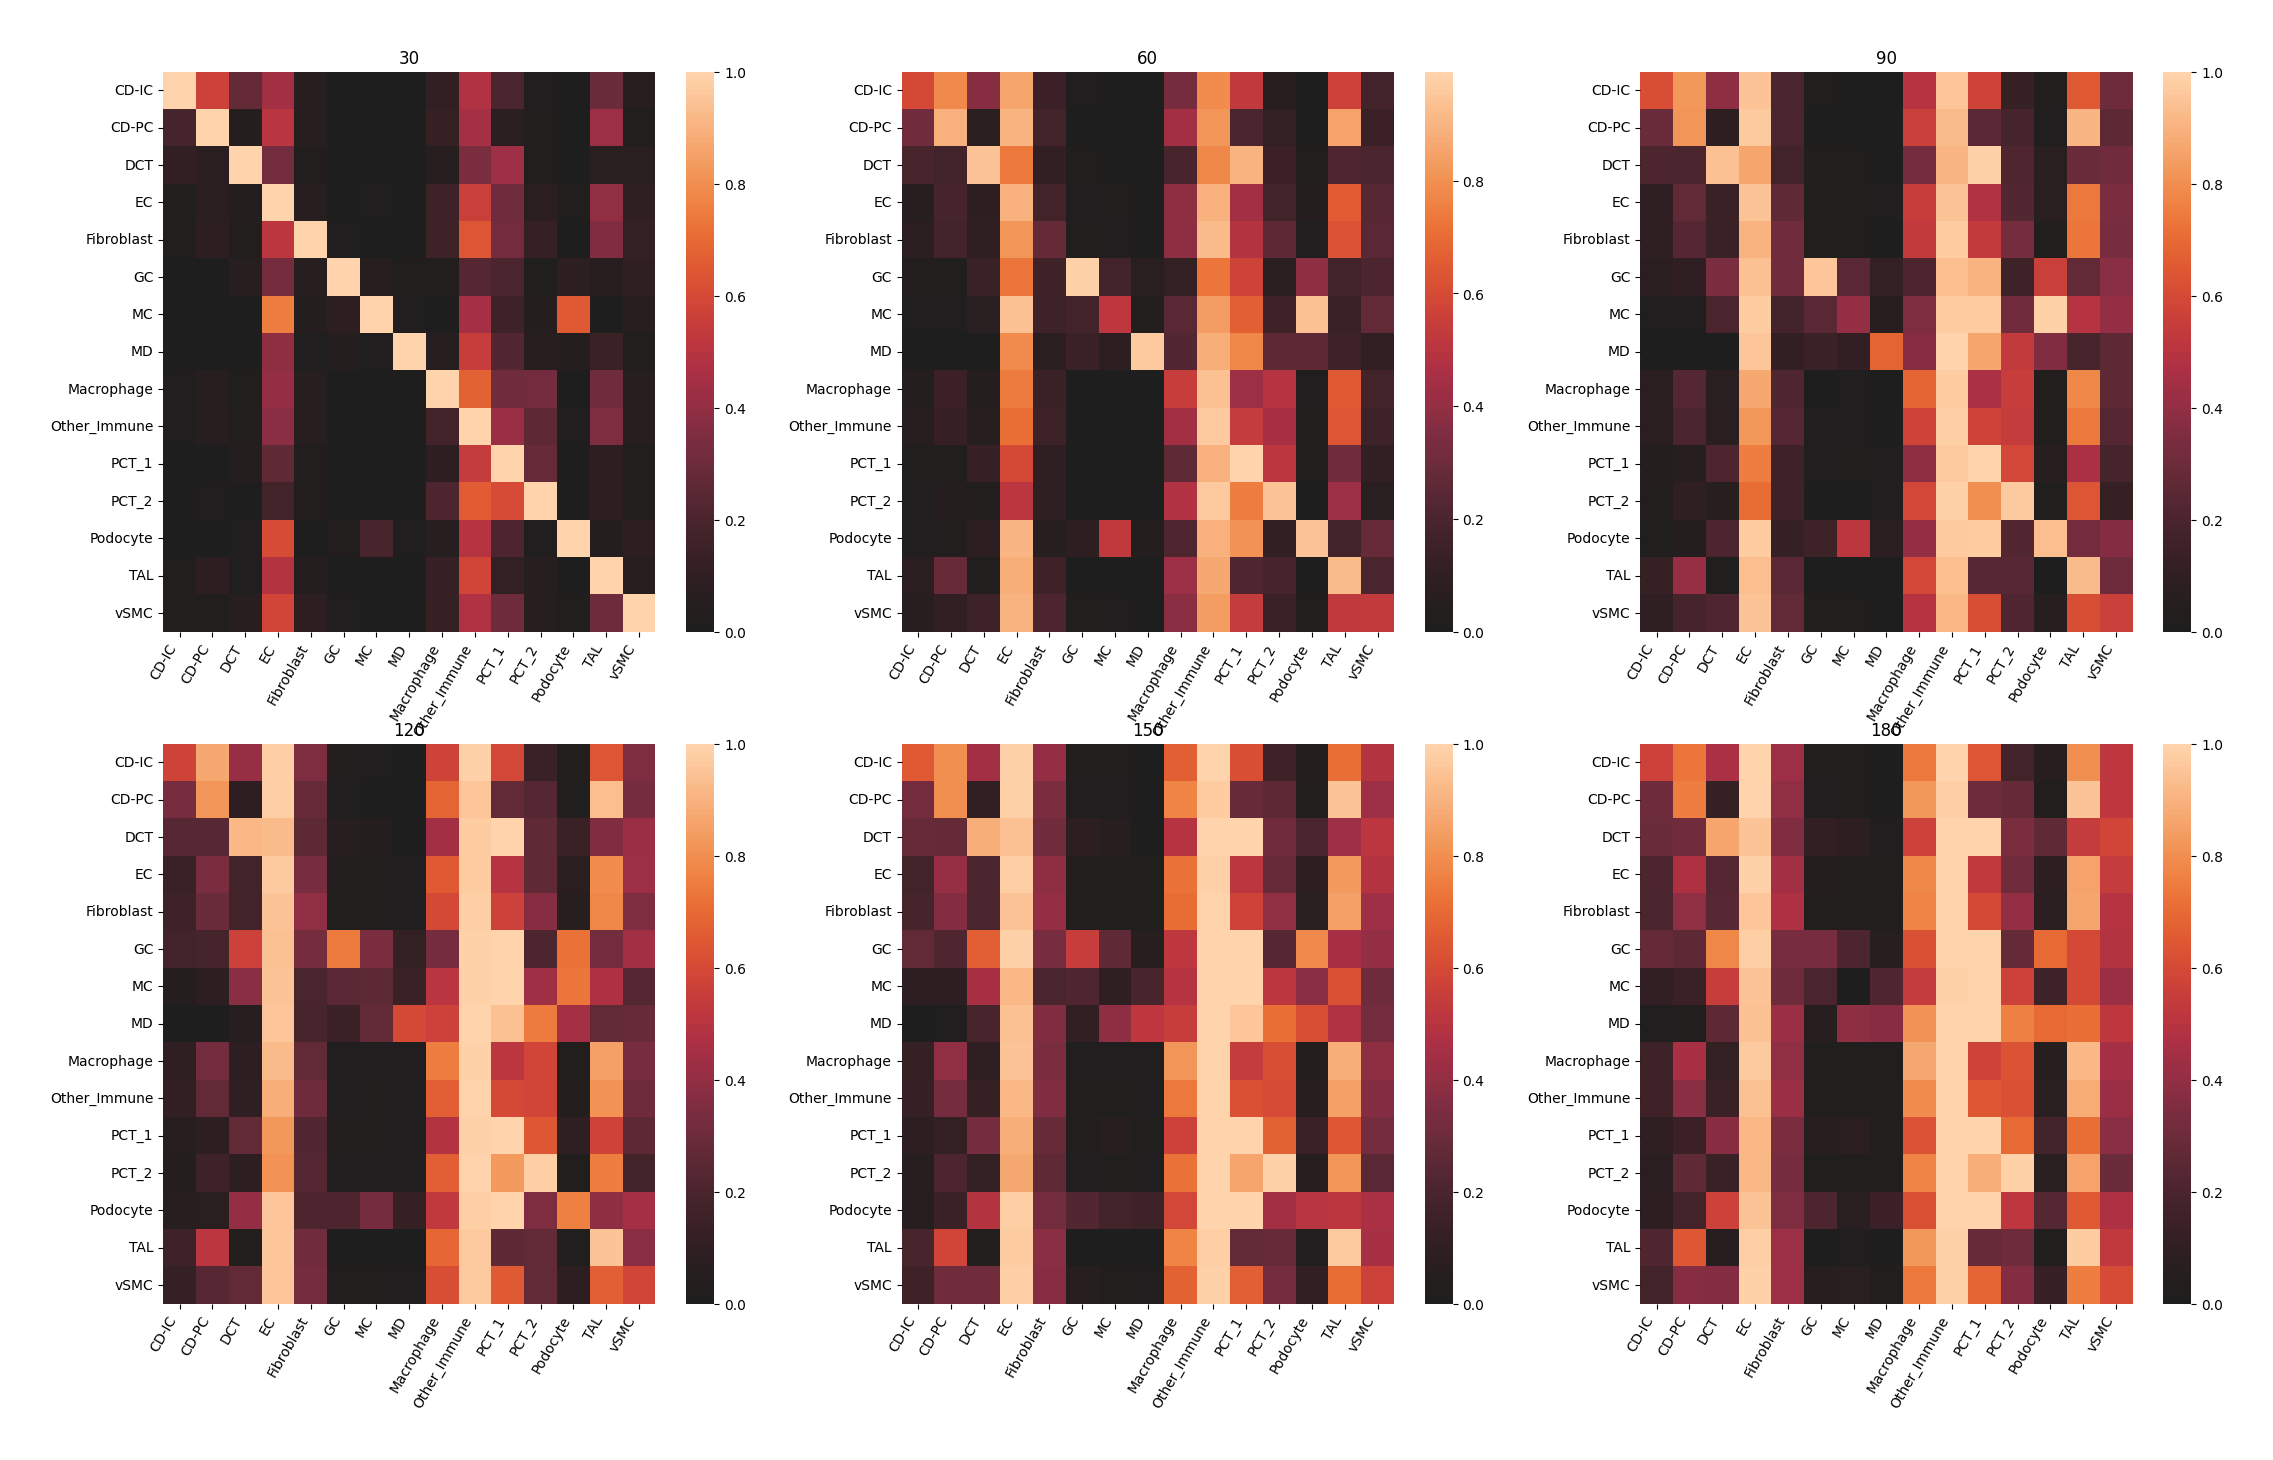
Each heatmap represents, under different distance interval in title, the probability of co-occurrence between each clusters.
Note
Similar to the plots above, the values in title represent a distance interval, for example, 30 is the interval from 0 to 30 while 60 is from 30 to 60 and so on.
[6]:
data.plt.co_occurrence_heatmap(res_key='co-occurrence', cluster_res_key='author_cell_type')
[2023-11-13 16:34:43][Stereo][177753][MainThread][139984851941184][plot_collection][82][INFO]: register plot_func co_occurrence_heatmap to <stereo.plots.plot_collection.PlotCollection object at 0x7f507a578cd0>
[6]:
Co-occurrence with a gene list
Stereopy’s co-occurrence also implement a method to calculate co-occurrence between genes and celltype by regrading cells of which genes express higher than gene_thresh (gene threshold) as a cluster. Here we use the marker genes of each cell types for instance.
[7]:
gene_list = ['ENSMUSG00000030945', 'ENSMUSG00000035783', 'ENSMUSG00000023013',
'ENSMUSG00000043144', 'ENSMUSG00000026394', 'ENSMUSG00000022748',
'ENSMUSG00000028017', 'ENSMUSG00000062515', 'ENSMUSG00000021765',
'ENSMUSG00000018339', 'ENSMUSG00000073421', 'ENSMUSG00000060586',
'ENSMUSG00000032758', 'ENSMUSG00000035202', 'ENSMUSG00000069516',
'ENSMUSG00000092341', 'ENSMUSG00000025608', 'ENSMUSG00000070645',
'ENSMUSG00000026678', 'ENSMUSG00000040808', 'ENSMUSG00000027202',
'ENSMUSG00000031766', 'ENSMUSG00000049775', 'ENSMUSG00000030963']
data.tl.co_occurrence(
method='stereopy',
cluster_res_key='author_cell_type',
res_key='co-occurrence_gene',
dist_thres=180, # max threshold to measure co-occurence
steps=6, # step numbers to divide threshold interval evenly
genelist=gene_list,
gene_thresh=2, # min threshold for gene expression in a cell
n_jobs=-1
)
[7]:
AnnData object with n_obs × n_vars = 31600 × 21319
obs: 'assay_ontology_term_id', 'self_reported_ethnicity_ontology_term_id', 'is_primary_data', 'organism_ontology_term_id', 'sample', 'tissue_ontology_term_id', 'disease_state', 'sex_ontology_term_id', 'genotype', 'development_stage_ontology_term_id', 'author_cell_type', 'cell_type_ontology_term_id', 'disease_ontology_term_id', 'donor_id', 'suspension_type', 'cell_type', 'assay', 'disease', 'organism', 'sex', 'tissue', 'self_reported_ethnicity', 'development_stage'
var: 'feature_is_filtered', 'feature_name', 'feature_reference', 'feature_biotype'
uns: 'schema_version', 'title', 'sn', 'co-occurrence', 'co-occurrence_gene'
obsm: 'X_spatial', 'spatial'
[8]:
data.plt.co_occurrence_plot(res_key='co-occurrence_gene')
[8]:
On multi-sample
Here also provide a metrics to analysis multi-sample co-occurrence. The metrics include integrate and compare, which is controled by a parameter called scope. Integrate analysis will be conducted when scope is seperated by ‘,’ like scope = 'WT,BTBR' and otherwise by ‘|’ like scope = 'WT|BTBR'. In this demo, we will show both two.
Load the other one from BTBR
[9]:
data_btbr = st.io.read_h5ad('../data/Puck_191204_15.h5ad')
data_btbr.position = data_btbr._ann_data.obsm['X_spatial']
[10]:
data_btbr.tl.co_occurrence(
method='stereopy',
cluster_res_key='author_cell_type',
res_key='co-occurrence',
dist_thres=180, # max threshold to measure co-occurence
steps=6, # step numbers to divide threshold interval evenly
genelist=None,
gene_thresh=0, # min threshold for gene expression in a cell
n_jobs=-1
)
[2023-11-13 16:56:24][Stereo][177753][MainThread][139984851941184][st_pipeline][77][INFO]: register algorithm co_occurrence to <stereo.core.st_pipeline.AnnBasedStPipeline object at 0x7f4f15281520>
[10]:
AnnData object with n_obs × n_vars = 35132 × 21239
obs: 'assay_ontology_term_id', 'self_reported_ethnicity_ontology_term_id', 'is_primary_data', 'organism_ontology_term_id', 'sample', 'tissue_ontology_term_id', 'disease_state', 'sex_ontology_term_id', 'genotype', 'development_stage_ontology_term_id', 'author_cell_type', 'cell_type_ontology_term_id', 'disease_ontology_term_id', 'donor_id', 'suspension_type', 'cell_type', 'assay', 'disease', 'organism', 'sex', 'tissue', 'self_reported_ethnicity', 'development_stage'
var: 'feature_is_filtered', 'feature_name', 'feature_reference', 'feature_biotype'
uns: 'schema_version', 'title', 'sn', 'co-occurrence'
obsm: 'X_spatial', 'spatial'
MSData construction
[11]:
ms_data = MSData()
ms_data['WT'] = data
ms_data['BTBR'] = data_btbr
ms_data
[11]:
ms_data: {'WT': (31600, 21319), 'BTBR': (35132, 21239)}
num_slice: 2
names: ['WT', 'BTBR']
obs: []
var: []
relationship: other
var_type: intersect to 0
mss: []
[12]:
ms_data.integrate()
ms_data.to_integrate(res_key = 'author_cell_type', scope = slice_generator[:], _from=slice_generator[:], type='obs', item=['author_cell_type']*ms_data.num_slice)
Integrate metrics
[13]:
from stereo.algorithm.co_occurrence import CoOccurrence
[15]:
CoOccurrence.ms_co_occur_integrate(
ms_data=ms_data,
scope='WT,BTBR',
use_col='author_cell_type',
res_key='co-occurrence'
)
[16]:
ms_data.plt.co_occurrence_heatmap(res_key='co-occurrence', cluster_res_key='author_cell_type')
[2023-11-13 17:03:17][Stereo][177753][MainThread][139984851941184][ms_pipeline][128][INFO]: register plot_func co_occurrence_heatmap to <class 'stereo.core.stereo_exp_data.StereoExpData'>-139977635259632
[16]:
Compare metrics
[17]:
CoOccurrence.ms_co_occur_integrate(
ms_data=ms_data,
scope='WT|BTBR',
use_col='author_cell_type',
res_key='co-occurrence'
)
[19]:
ms_data.plt.co_occurrence_heatmap(res_key='co-occurrence', cluster_res_key='author_cell_type')
[2023-11-13 17:03:32][Stereo][177753][MainThread][139984851941184][ms_pipeline][128][INFO]: register plot_func co_occurrence_heatmap to <class 'stereo.core.stereo_exp_data.StereoExpData'>-139977635259632
[19]: