Spatial Hotspot
Spatial hotspot is a tool for identifying informative genes or gene modules in a single-cell dataset. Importantly, ‘informative’ here is defined based on how well a gene’s variation agrees with certain cell metric - some similarity mapping between cells.
Genes which are informative are those whose expression varies in similar way among cells which are nearby in the given metric.
Analysis and plot
Please download our example data beforehand.
[ ]:
import warnings

warnings.filterwarnings('ignore')
import stereo as st

data_path = './SS200000135TL_D1.tissue.gef'

# read the GEF file information
st.io.read_gef_info(data_path)

# read the GEF file
data = st.io.read_gef(file_path=data_path, bin_size=50)

# Preprocessing
data.tl.cal_qc()

#Filtering
data.tl.filter_cells(min_gene=200, min_n_genes_by_counts=3, max_n_genes_by_counts=2500, pct_counts_mt=5, inplace=True)

#Normalization
data.tl.raw_checkpoint()
data.tl.raw
#data.tl.sctransform(res_key='sctransform', n_genes=2000, filter_hvgs=False, inplace=True)
data.tl.normalize_total(target_sum=10000)
data.tl.log1p()

#Highly variable genes
data.tl.highly_variable_genes(min_mean=0.0125, max_mean=3,min_disp=0.5, n_top_genes=2000, res_key='highly_variable_genes')
data.tl.scale()

#  analysis of spatial hotspot
data.tl.spatial_hotspot(
                    use_highly_genes=True,
                    use_raw=True,
                    hvg_res_key='highly_variable_genes',
                    model='normal',
                    n_neighbors=30,
                    n_jobs=20,
                    fdr_threshold=0.05,
                    min_gene_threshold=10,
                    res_key='spatial_hotspot',
                    )
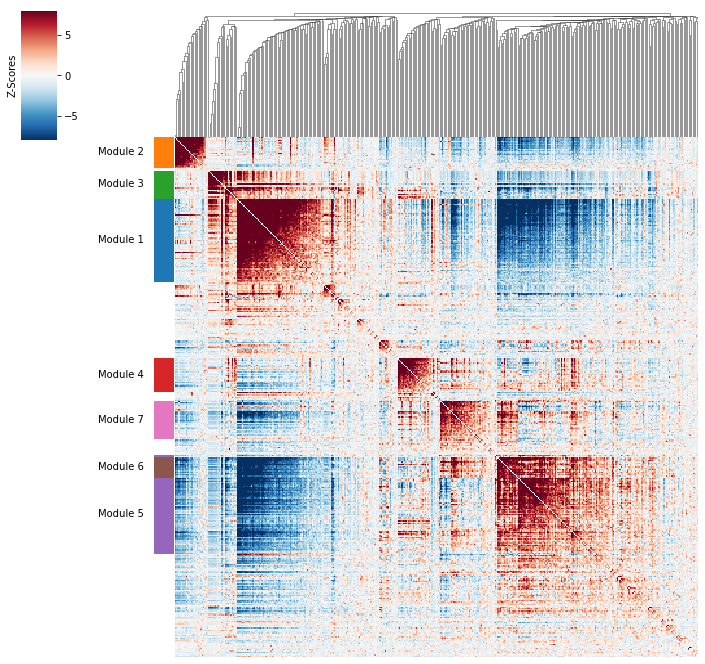
A convenient method is supplied to plot the results of hotspot.create_modules.
[7]:
data.plt.hotspot_local_correlations()
Here we could visualize module scores with spatial position.
[8]:
data.plt.hotspot_modules()

Performance
The example data contains 35890 cells (bins) and 20816 genes.
Machine configuration as below:
physical cores |
logic cores |
memory |
|---|---|---|
12 |
48 |
250G |
This module only supports single process.
process |
memory(max) |
cpu |
time |
|---|---|---|---|
1 |
4.25G |
2670% |
2m26s |